All official European Union website addresses are in the europa.eu domain.
See all EU institutions and bodies
An official website of the European Union | How do you know?
Environmental information systems
EN

All official European Union website addresses are in the europa.eu domain.
See all EU institutions and bodiesChart (static)
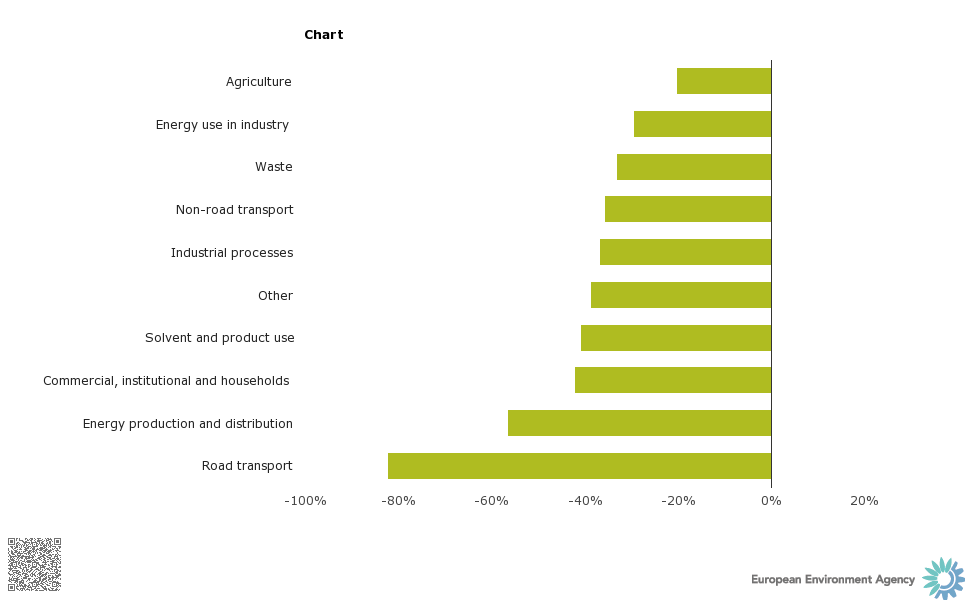
Change in non-methane volatile organic compounds emissions for each sector between 1990 and 2011.