All official European Union website addresses are in the europa.eu domain.
Chart (static)Published 29 Jan 2014Modified 20 Sept 2024
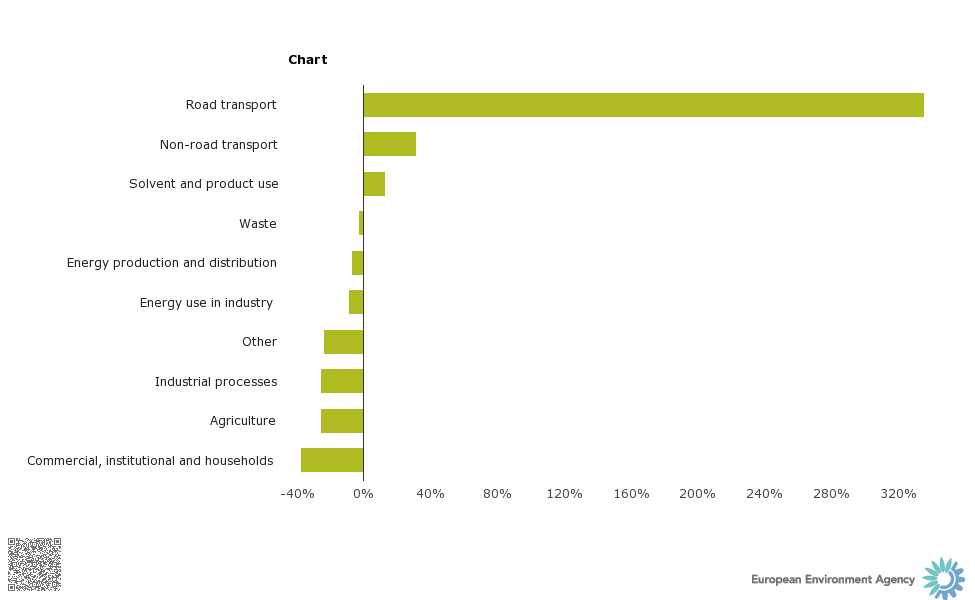
Note: Percentage change in ammonia (NH3) emissions for each sector between 1990 and 2011.