All official European Union website addresses are in the europa.eu domain.
See all EU institutions and bodies
An official website of the European Union | How do you know?
Environmental information systems
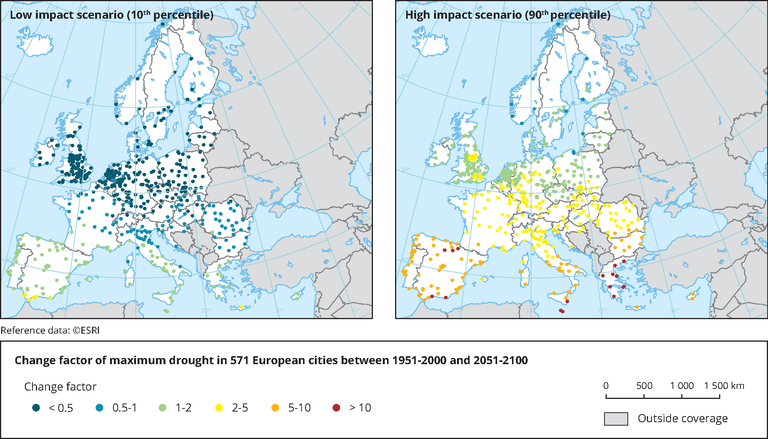
The map presents the projected change in drought magnitude in the second half of the 21st century compared to the hisorical period (1951-2000).
Loading