All official European Union website addresses are in the europa.eu domain.
See all EU institutions and bodiesAn official website of the European Union | How do you know?
Environmental information systems
EN
- БългарскиBG
- češtinaCS
- HrvatskiHR
- danskDA
- NederlandsNL
- ελληνικάEL
- EnglishEN
- eestiET
- SuomiFI
- FrançaisFR
- DeutschDE
- magyarHU
- ÍslenskaIS
- italianoIT
- LatviešuLV
- lietuviųLT
- MaltiMT
- NorskNO
- polskiPL
- PortuguêsPT
- RomânăRO
- slovenčinaSK
- SlovenščinaSL
- EspañolES
- SvenskaSV
- TürkçeTR
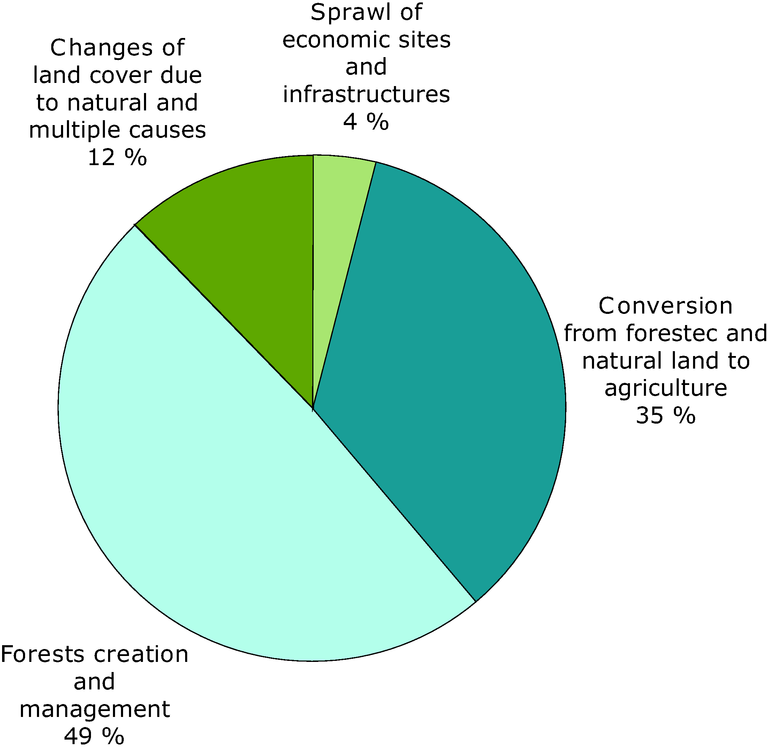
Cause of loss of wetlands
Chart (static)
-
Downloads
Data sources
Metadata
More info
Loading
Austria, Belgium, Bulgaria, Cyprus, Czechia, Denmark, Estonia, Finland, France, Germany, Hungary, Ireland, Italy, Latvia, Lithuania, Luxembourg, Malta, Netherlands, Poland, Portugal, Romania, Slovakia, Slovenia, Spain, Sweden
1990
2000
2006
2009
- Some 35 % of the change in wetland areas between 2000 and 2006 was due to conversion to agriculture and 49 % to forest creation and afforestation.
- Of the wetland area converted to other land uses between 1990 and 2000, 2 % were artificialised (e.g. urban areas), 7 % became agricultural, 12 % water bodies, and 79 % forest and semi-natural areas (EEA, 2009).