All official European Union website addresses are in the europa.eu domain.
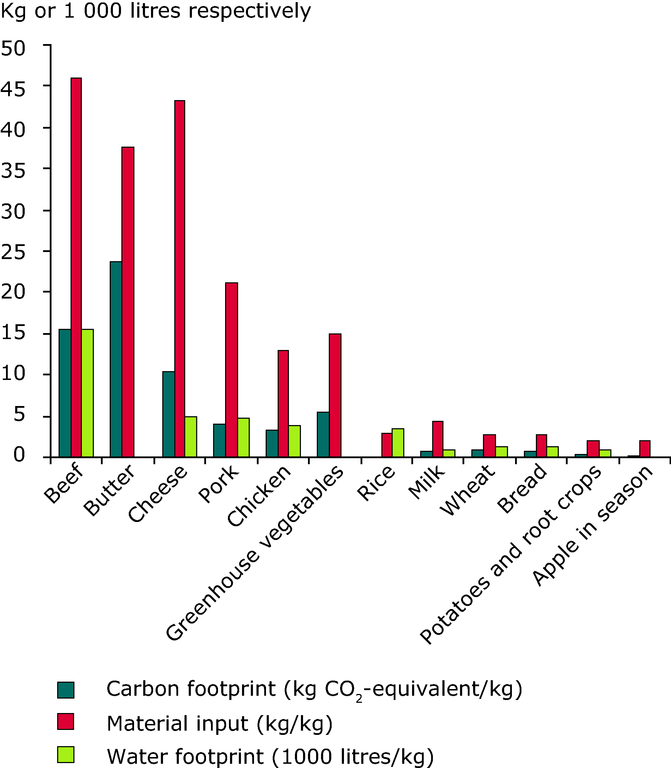
See all EU institutions and bodiesThe figure compares carbon, material and water footprints for selected foodstuffs (beef, butter, cheese, pork, chicken, greenhouse vegetables, rice, milk, wheat, bread, potatoes and root crop, and apple in season).
Loading


