All official European Union website addresses are in the europa.eu domain.
See all EU institutions and bodies
An official website of the European Union | How do you know?
Environmental information systems
EN

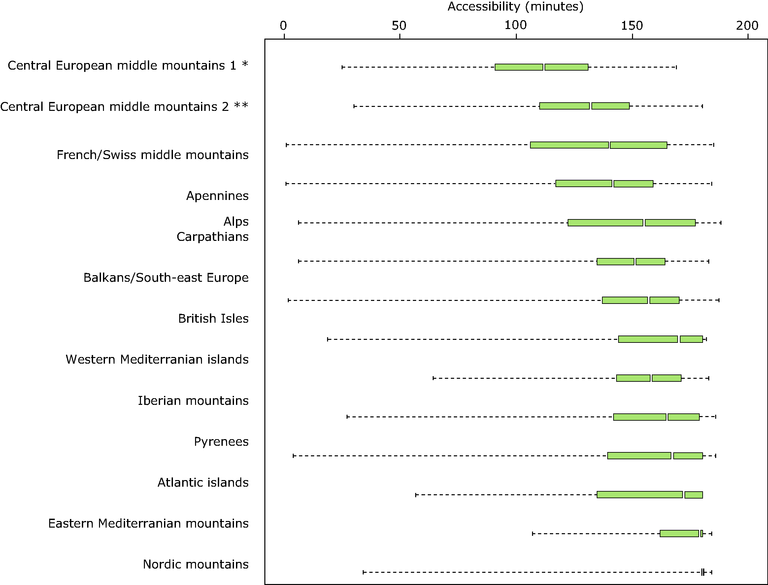
The green bars show values between the 25th and 75th percentiles. The vertical bars are the median
Loading