All official European Union website addresses are in the europa.eu domain.
See all EU institutions and bodiesAn official website of the European Union | How do you know?
Environmental information systems
EN
- БългарскиBG
- češtinaCS
- HrvatskiHR
- danskDA
- NederlandsNL
- ελληνικάEL
- EnglishEN
- eestiET
- SuomiFI
- FrançaisFR
- DeutschDE
- magyarHU
- ÍslenskaIS
- italianoIT
- LatviešuLV
- lietuviųLT
- MaltiMT
- NorskNO
- polskiPL
- PortuguêsPT
- RomânăRO
- slovenčinaSK
- SlovenščinaSL
- EspañolES
- SvenskaSV
- TürkçeTR
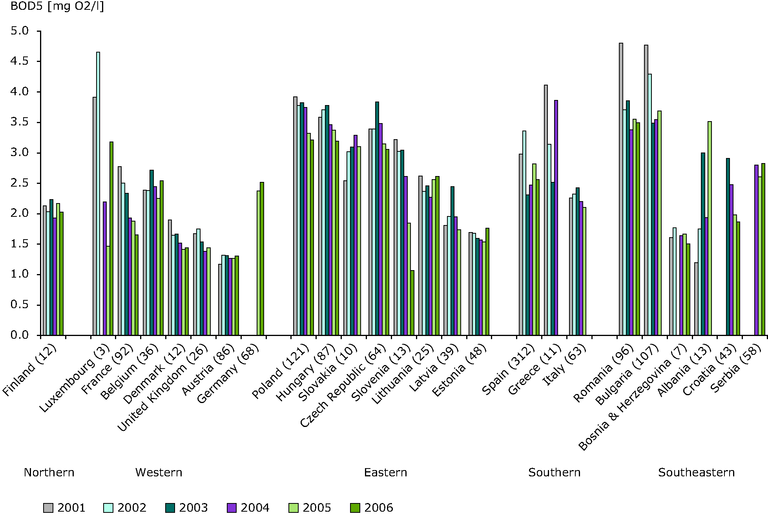
BOD5 concentrations in rivers between 2001 and 2006 in European countries
Chart (static)
Number of river monitoring stations included in analysis noted in brackets
Downloads
Data sources
Metadata
More info
Loading
Albania, Austria, Belgium, Bosnia and Herzegovina, Bulgaria, Croatia, Czechia, Denmark, Estonia, Finland, France, Germany, Greece, Hungary, Ireland, Italy, Latvia, Lithuania, Luxembourg, North Macedonia, Poland, Serbia, Slovakia, Slovenia, Spain, United Kingdom
Concentrations by countries are expressed as the mean of the annual mean concentrations for the period 2001 to 2006. The figure shows the same number of stations per country as included in regions of Europe of Fig. 2 using consistent time series trends between 1992 and 2006 (Northern, Western and Eastern Europe), between 2000 and 2006 (Southern Europe) and between 2001 and 2006 (Southeastern Europe). Countries with shorter consistent time series as given in Fig. 2 are added in this figure. These are Belgium (BE) (2001-2006), Croatia (HR) (2003-2006), Germany (DE) (2005-2006), Poland (PL) (1997-2006) and Serbia (RS) (2004-2006). In the brackets, the periods are noted for which consistent time series trends have been calculated using only stations that have recorded concentrations for each year included in the time series. Mean concentrations of Macedonia, FYR (MK) are excluded from the graph having higher concentrations than the figure maximum (5 mg O2/l): 7,38 (2001), 9,17 (2002), 6,10 (2003), 8,49 (2004), 6,54 (2005), 7,13 (2006).