All official European Union website addresses are in the europa.eu domain.
See all EU institutions and bodiesAn official website of the European Union | How do you know?
Environmental information systems
EN
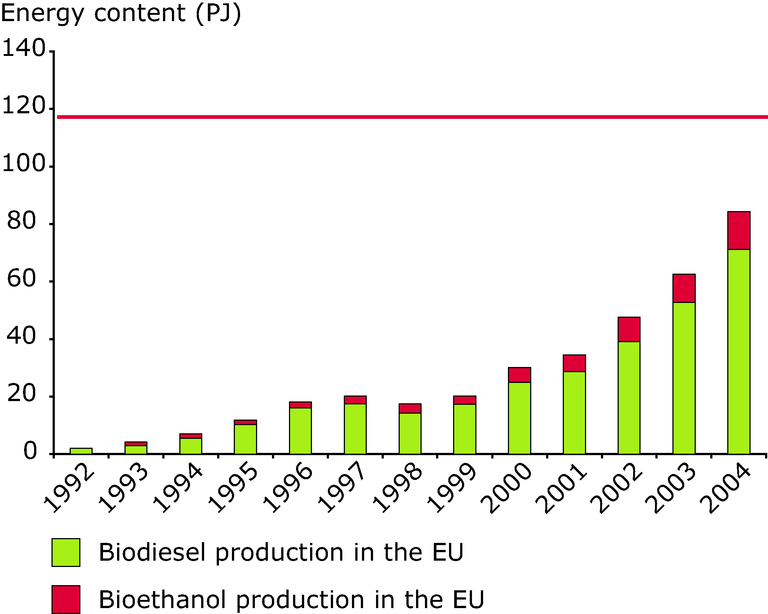
For the years before 2004, data apply to the EU-15 for 2004, production of the EU-25 is taken into account
Loading