All official European Union website addresses are in the europa.eu domain.
See all EU institutions and bodiesAn official website of the European Union | How do you know?
Environmental information systems
EN
- БългарскиBG
- češtinaCS
- HrvatskiHR
- danskDA
- NederlandsNL
- ελληνικάEL
- EnglishEN
- eestiET
- SuomiFI
- FrançaisFR
- DeutschDE
- magyarHU
- ÍslenskaIS
- italianoIT
- LatviešuLV
- lietuviųLT
- MaltiMT
- NorskNO
- polskiPL
- PortuguêsPT
- RomânăRO
- slovenčinaSK
- SlovenščinaSL
- EspañolES
- SvenskaSV
- TürkçeTR
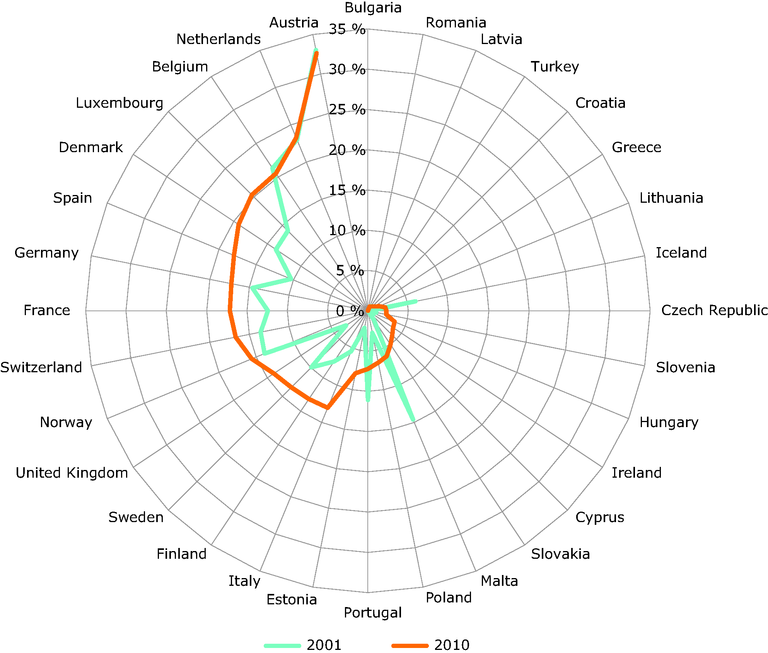
Bio-waste recycling as a percentage of municipal waste generation in 32 European countries, 2001 and 2010
Chart (static)
Bio-waste recycling in 32 European countries as a percentage of total municipal waste generated in 2001 and 2010
Downloads
Data sources
Metadata
More info
Loading
- Municipal waste management in Iceland
- Municipal waste management in Austria
- Municipal waste management in Luxembourg
- Municipal waste management in Slovenia
- Municipal waste by NUTS 2 regions - pilot project
- Municipal waste by waste management operations (env_wasmun)
- Municipality waste management in Italy (Rapporto Rifiuti Urbani 2012 — Italiano - Ispra)
Methodology
The amounts of municipal waste reported as 'other recycling (including composting) has been divided by the amounts of municipal waste generated by country.
Additional information
Notes: The further from the radar chart’s centre, the better the waste management. The bio-waste recycling rate is calculated as percentage of recycled bio-waste per MSW generated. According to Eurostat the comparability of the data over time is high. However, some breaks in the time series are documented, which can influence the comparability between countries and within a country. Generally, the quality of the data seems to better in the end of the period between 2001 and 2010 than in the beginning. For Iceland is used 2008 data for 2010. For Slovenia 2002 data are used for 2001 and 2009 data are used for 2010. Croatia is not included for 2001