All official European Union website addresses are in the europa.eu domain.
See all EU institutions and bodies
An official website of the European Union | How do you know?
Environmental information systems
Average total concentration of pesticides in surface water in the Vemmenhög catchment area vs applied amounts analysed (1992-2018)
Chart (static)
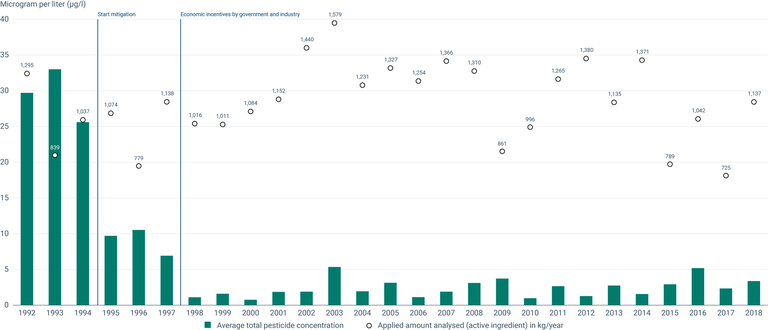
The vertical bars represent the time-weighted mean concentration of active substances, as measured from May to September each year between 1992 and 2018 (except May to June in 1993). The dots represent the total amount of active substances (of those analysed) that were applied annually on field in the Vemmenhög area during the same period (1992-2018).
Downloads
Data sources
Metadata
More info
Loading
- Vemmenhög project: average total pesticide concentrations vs. applied amounts analysed [No direct URL to the dataset]
- Kreuger (2023).
Methodology
The average total pesticide concentrations found in surface waters is presented as Time Weighted Mean Concentration between the months of May to September of each year (with the exclusion of 1993, which was only between May and June). The water was sampled with an ISCO machine. Weekly samples consisting of around 100 subsamples were collected. The data on applied amounts of the analysed pesticides are presented as (kg/year), and were collected from interviews with farmers in the catchment area. Of all the substances used in the catchment area, more than 90% of the amounts applied on field consist of the substances that were analysed. The applied amounts of non-analysed substances were not included in the chart.