All official European Union website addresses are in the europa.eu domain.
See all EU institutions and bodiesAn official website of the European Union | How do you know?
Environmental information systems
EN
- БългарскиBG
- češtinaCS
- HrvatskiHR
- danskDA
- NederlandsNL
- ελληνικάEL
- EnglishEN
- eestiET
- SuomiFI
- FrançaisFR
- DeutschDE
- magyarHU
- ÍslenskaIS
- italianoIT
- LatviešuLV
- lietuviųLT
- MaltiMT
- NorskNO
- polskiPL
- PortuguêsPT
- RomânăRO
- slovenčinaSK
- SlovenščinaSL
- EspañolES
- SvenskaSV
- TürkçeTR
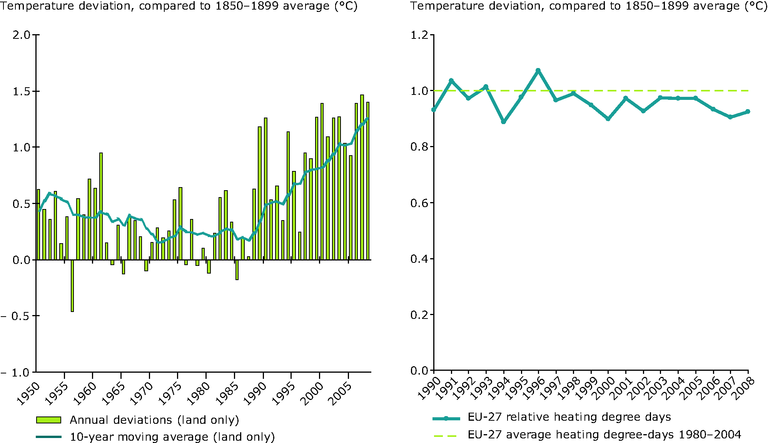
Average temperatures in Europe and relative heating degree days in EU‑27
Chart (static)
Average temperatures in Europe and relative heating degree days in EU‑27
Downloads
Data sources
Metadata
More info
Loading
- Austria
- Belgium
- Bulgaria
- Cyprus
- Czechia
- Denmark
- Estonia
- Finland
- France
- Germany
- Greece
- Hungary
- Ireland
- Italy
- Latvia
- Lithuania
- Luxembourg
- Malta
- Netherlands
- Poland
- Portugal
- Romania
- Slovakia
- Slovenia
- Spain
- Sweden
- United Kingdom
1950-2008
Average temperatures: the source of the original data is the Climatic Research Unit of the University of East Anglia. The annual deviations of the European mean annual temperature shown in the chart have been adjusted from the initial data to be relative to the period 1850–1899, to better monitor the EU objective not to exceed 2 °C above pre-industrial values. Over Europe, average annual temperatures during the real pre-industrial period (1750–1799) were very similar to those during 1850–1899. Europe is defined as 35° to 70° north, – 25° to 30° east, plus Turkey (35° to 40° north, 30° to 45° east). The resulting temperature anomalies were obtained using KNMI's climate explorer.