All official European Union website addresses are in the europa.eu domain.
See all EU institutions and bodiesAn official website of the European Union | How do you know?
Environmental information systems
EN
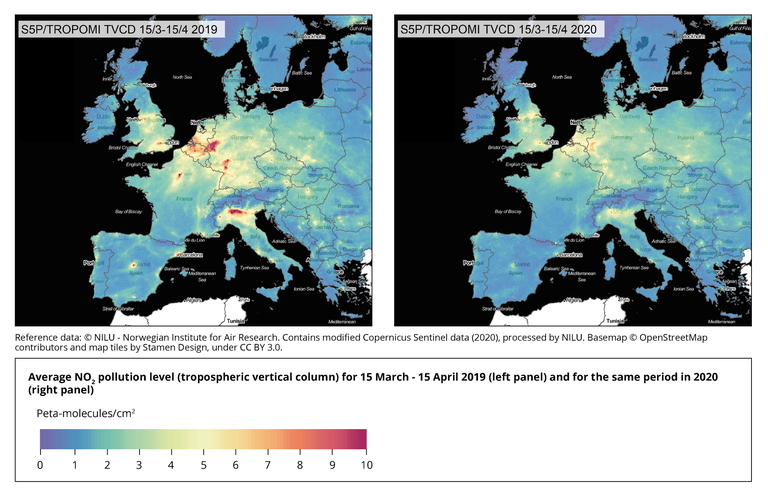
The figure shows the average NO2 pollution level (tropospheric vertical column) from Sentinel-5P/TROPOMI for the period 15 March to 15 April 2019 and for the same period in 2020.
Loading