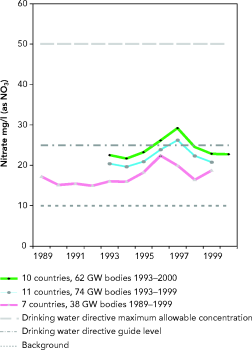
It also shows the drinking water directive?s maximum allowable concentrations and guide levels, and the typical background concentration. 1993?99 time series: Austria, Belgium, Bulgaria, Denmark, Estonia, Hungary, Latvia, Lithuania, Netherlands, Slovak Republic, Slovenia, Spain. 1993?2000 time series: Austria, Belgium, Bulgaria, Denmark, Estonia, Latvia, Lithuania, Netherlands, Slovak Republic, Slovenia. 1989?99 time series: Bulgaria, Denmark, Estonia, Hungary, Lithuania, Netherlands, Slovak Republic. Notes: Figure 3.3 is based on the data for the latest year available (given after the country name). The numbers of groundwater bodies per country included in the presentation are given after the year. The four classes represent the percentage of sampling sites within each groundwater body where annual average nitrate concentrations exceed 50 mg NO3/l.