All official European Union website addresses are in the europa.eu domain.
See all EU institutions and bodies
An official website of the European Union | How do you know?
Environmental information systems
EN

- БългарскиBG
- češtinaCS
- HrvatskiHR
- danskDA
- NederlandsNL
- ελληνικάEL
- EnglishEN
- eestiET
- SuomiFI
- FrançaisFR
- DeutschDE
- magyarHU
- ÍslenskaIS
- italianoIT
- LatviešuLV
- lietuviųLT
- MaltiMT
- NorskNO
- polskiPL
- PortuguêsPT
- RomânăRO
- slovenčinaSK
- SlovenščinaSL
- EspañolES
- SvenskaSV
- TürkçeTR
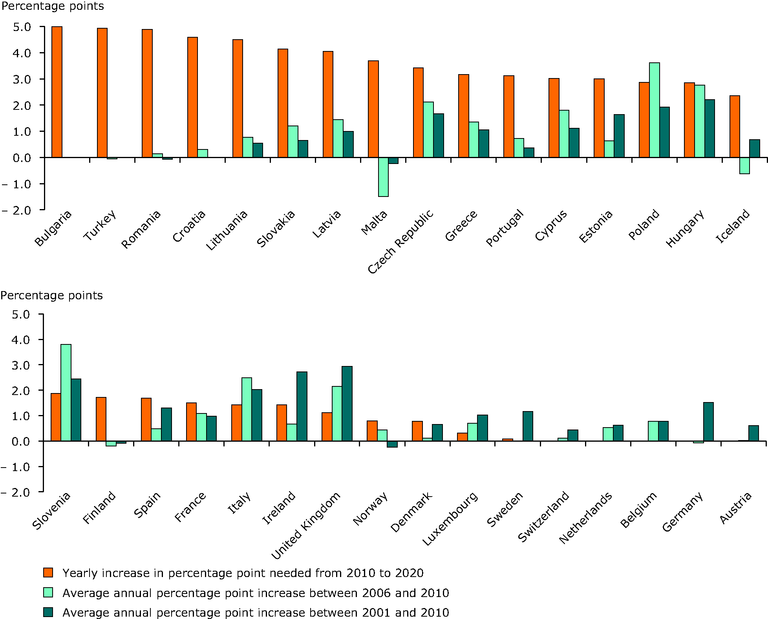
Average annual percentage point increase needed in 32 European countries to reach 50 % recycling by 2020 and past rates achieved
Chart (static)
The yearly average percentage point increase required by each country between 2010 and 2020 to reach the 50 % target and compared with the rates achieved in 2001–2006 and 2001–2010.
Downloads
Data sources
Metadata
More info
Loading
- Municipal waste management in Iceland
- Municipal waste management in Austria
- Municipal waste management in Luxembourg
- Municipal waste management in Slovenia
- Municipal waste by NUTS 2 regions - pilot project
- Municipality waste management in Italy (Rapporto Rifiuti Urbani 2012 — Italiano - Ispra)
- Municipal waste by waste management operations (env_wasmun)
- Austria
- Belgium
- Bulgaria
- Cyprus
- Czechia
- Denmark
- Estonia
- Europe
- Finland
- France
- Germany
- Greece
- Hungary
- Iceland
- Ireland
- Italy
- Latvia
- Liechtenstein
- Lithuania
- Luxembourg
- Malta
- Netherlands
- Norway
- Poland
- Portugal
- Romania
- Slovakia
- Slovenia
- Spain
- Sweden
- Switzerland
- Turkey
- United Kingdom
2001-2020
Methodology
The 2010 recycling rate has been deducted from the required 50% recycling rate by 2020. This figure has been divided with 10 years and compared with the average annnual percentage increase from 2001 to 2010 and from 2006 to 2010
Additional information
Notes: For Iceland is used 2008 data for 2010. For Slovenia 2002 data are used for 2001 and 2009 data are used for 2010. For Croatia only data for 2007 to 2010 are included. According to Eurostat the comparability of the data over time is high. However, some breaks in the time series are documented, which can influence the comparability between countries and within a country. Generally, the quality of the data seems to better in the end of the period between 2001 and 2010 than in the beginning. The trends for 2001-2005 are therefore less reliable than the 2006-2010 trends, and in some cases, trends might rather reflect changes in data collection than change in waste management.