All official European Union website addresses are in the europa.eu domain.
See all EU institutions and bodiesAn official website of the European Union | How do you know?
Environmental information systems
EN
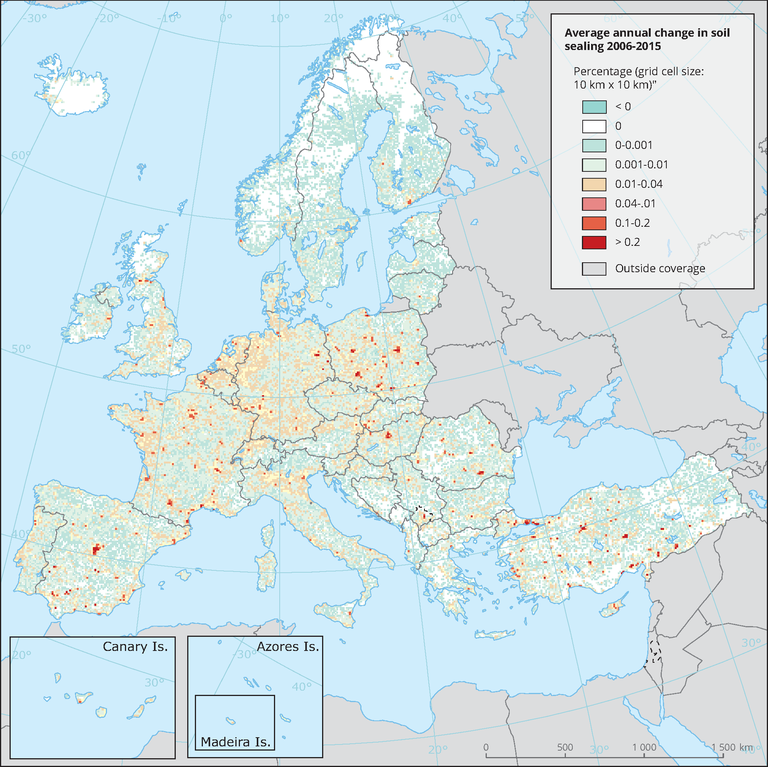
The map shows the percentage of the average annual change in soil sealing for each of the rectangular 10 km x 10 km grid cells, over the 2006-2015 period
Loading