All official European Union website addresses are in the europa.eu domain.
See all EU institutions and bodiesAn official website of the European Union | How do you know?
Environmental information systems
EN
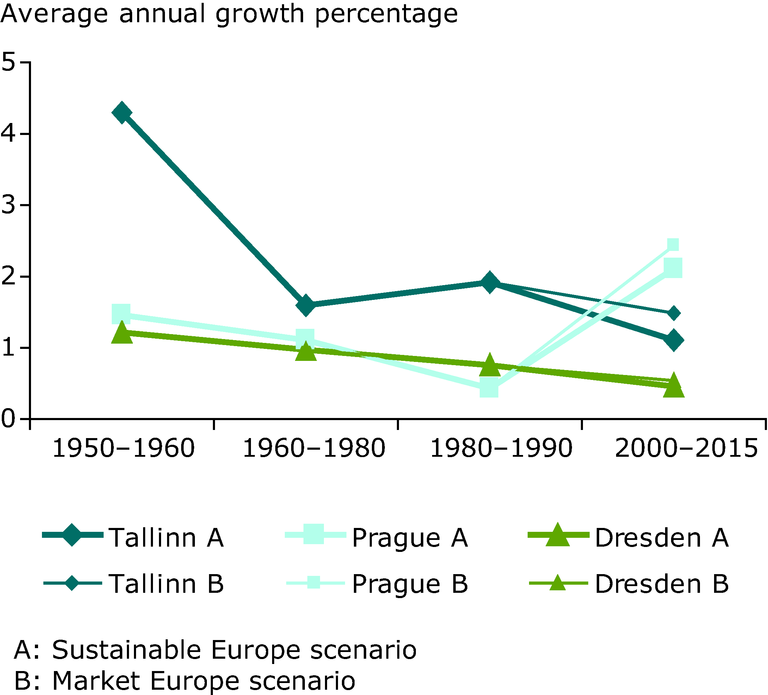
A: Sustainable Europe scenario
B: Market Europe scenario
Loading