All official European Union website addresses are in the europa.eu domain.
See all EU institutions and bodiesAn official website of the European Union | How do you know?
Environmental information systems
EN
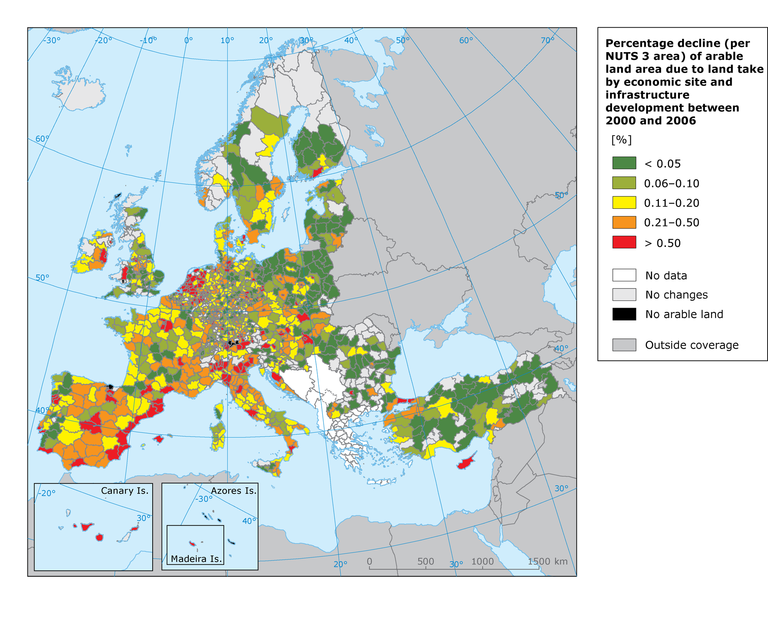
Percentage decline (per NUTS 3 area) of arable land area due to land take by economic site and infrastructure development between 2000 and 2006.
Loading