All official European Union website addresses are in the europa.eu domain.
See all EU institutions and bodiesAn official website of the European Union | How do you know?
Environmental information systems
EN
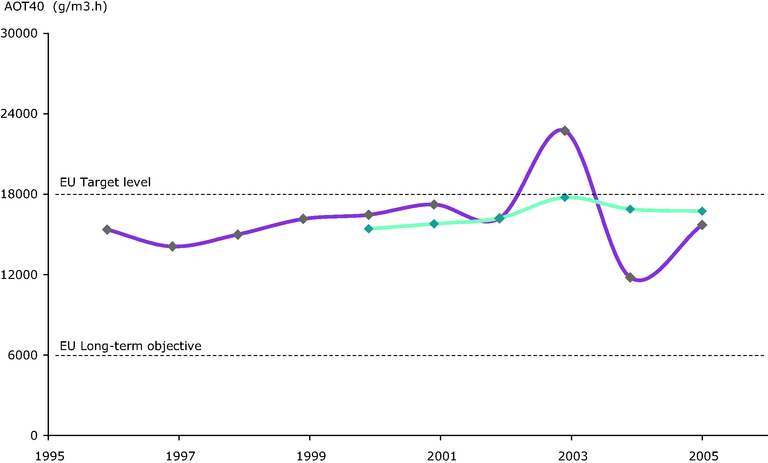
Average values over all rural stations which reported data over at least six years in the period 1996-2005
Loading