All official European Union website addresses are in the europa.eu domain.
See all EU institutions and bodiesAn official website of the European Union | How do you know?
Environmental information systems
EN
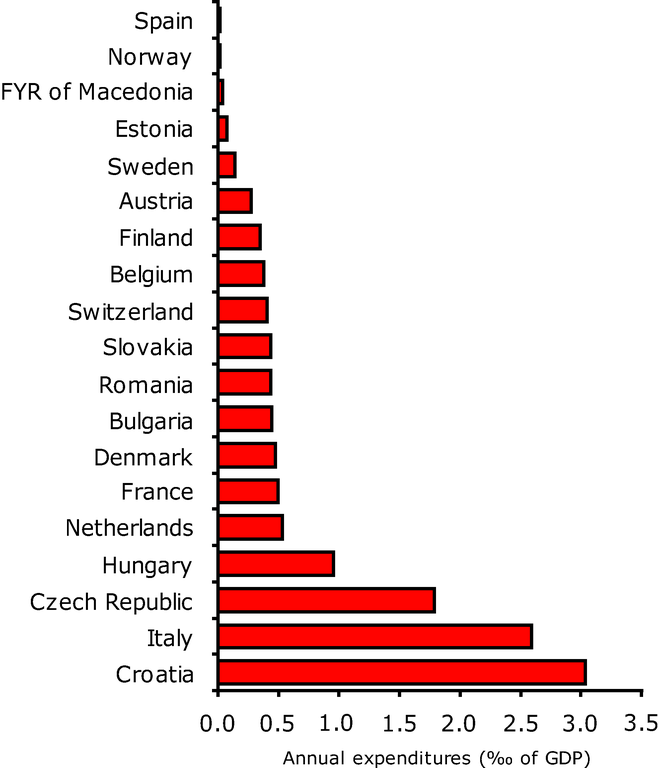
The graph shows annual expenditure for the management of contaminated sites as o/oo of GDP
Loading