All official European Union website addresses are in the europa.eu domain.
See all EU institutions and bodies
An official website of the European Union | How do you know?
Environmental information systems
EN

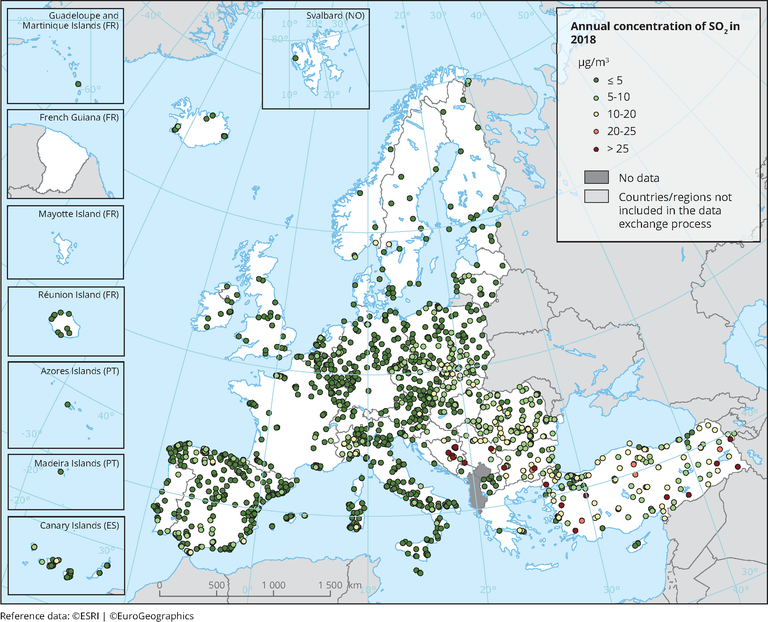
Observed concentrations of SO2 in 2018. The map shows the SO2 annual mean, which is not related to any legal standard, for comparison purposes. Only stations with more than 75 % of valid data have been included in the map.
Loading