All official European Union website addresses are in the europa.eu domain.
See all EU institutions and bodiesAn official website of the European Union | How do you know?
Environmental information systems
EN
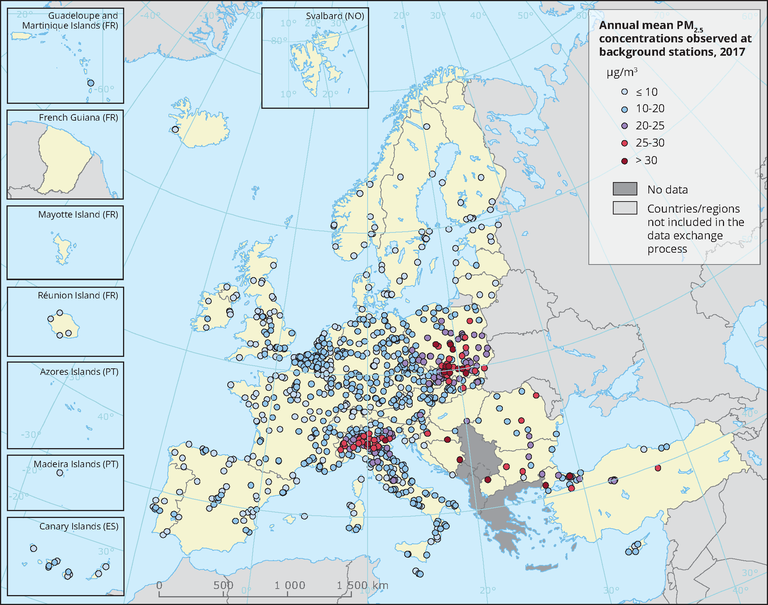
The figure shows the annual mean concentrations of particulate matter (PM2.5) observed at background stations in 2017.
Loading