All official European Union website addresses are in the europa.eu domain.
See all EU institutions and bodies
An official website of the European Union | How do you know?
Environmental information systems
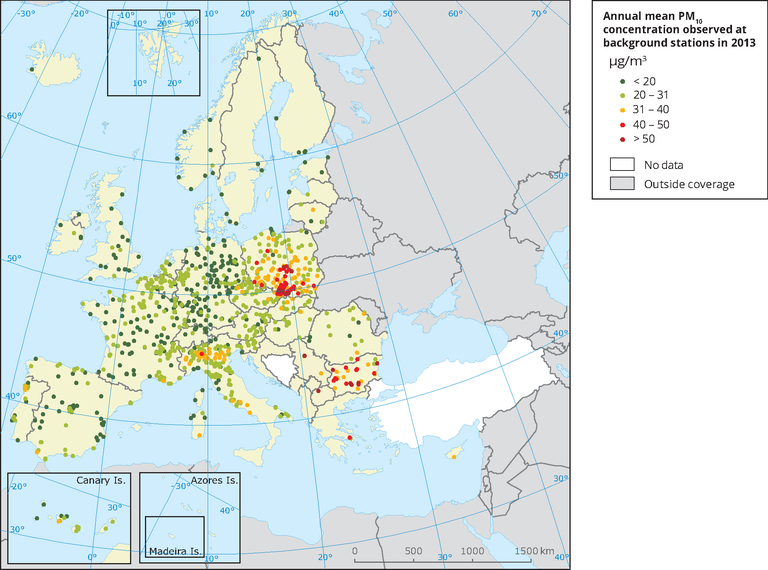
The figure shows the background concentrations of PM10 observed at traffic stations in 2013. The two highest PM10 concentration classes (dark orange and light orange) correspond to the 2005 annual limit value (40 μg/m3) and to a statistically derived level (31 μg/m3) corresponding to the 2005 daily limit value. The lowest class corresponds to the WHO air quality guideline for PM10 of 20 μg/m3.
Loading