All official European Union website addresses are in the europa.eu domain.
See all EU institutions and bodies
An official website of the European Union | How do you know?
Environmental information systems
EN

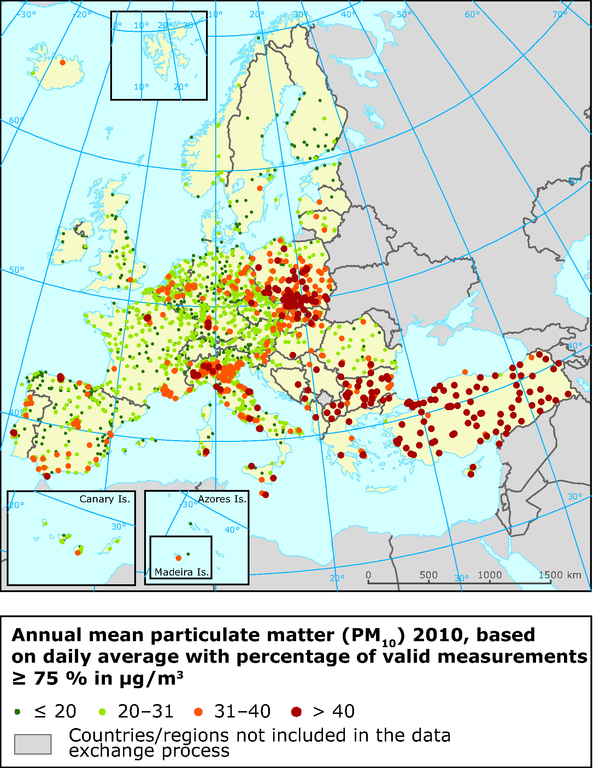
The red dots indicate stations reporting exceedances of
the 2005 annual limit value (40 μg/m3), as set out in
the Air Quality Directive.
The orange dots indicate stations reporting
exceedances of a statistically derived level (31 μg/m3)
corresponding to the 24–hour limit value, as set out in
the Air Quality Directive.
The pale green dots indicate stations reporting
exceedances of the WHO air quality guideline for PM10
of less than 20 μg/m3 but not in exceedance of limit
values as set out in the Air Quality Directive.
The dark green dots indicate stations reporting
concentrations below the WHO air quality guideline for
PM10 and implicitly below the limit values as set out in
the Air Quality Directive.
Loading