All official European Union website addresses are in the europa.eu domain.
See all EU institutions and bodiesAn official website of the European Union | How do you know?
Environmental information systems
EN
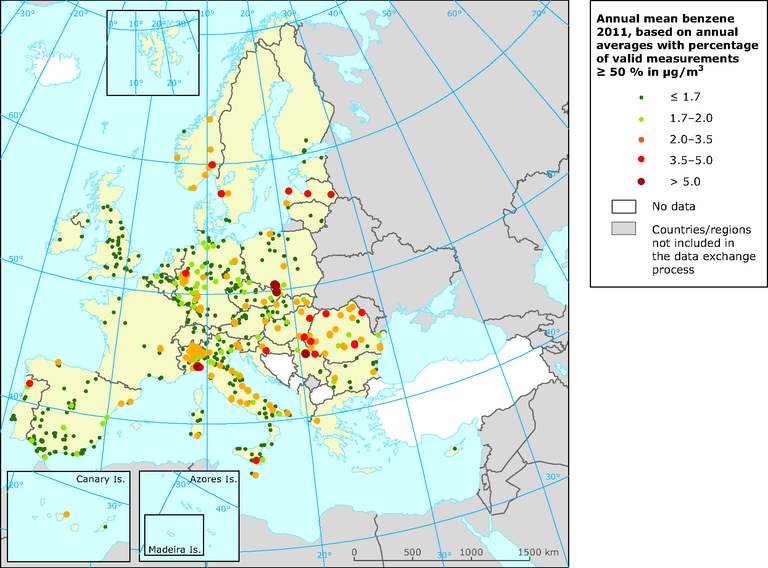
The map shows the annual mean benzene concentrations in 2011, based on annual averages with percentage of valid measurements >= 50% in μg/m3
Loading