All official European Union website addresses are in the europa.eu domain.
See all EU institutions and bodies
An official website of the European Union | How do you know?
Environmental information systems
EN

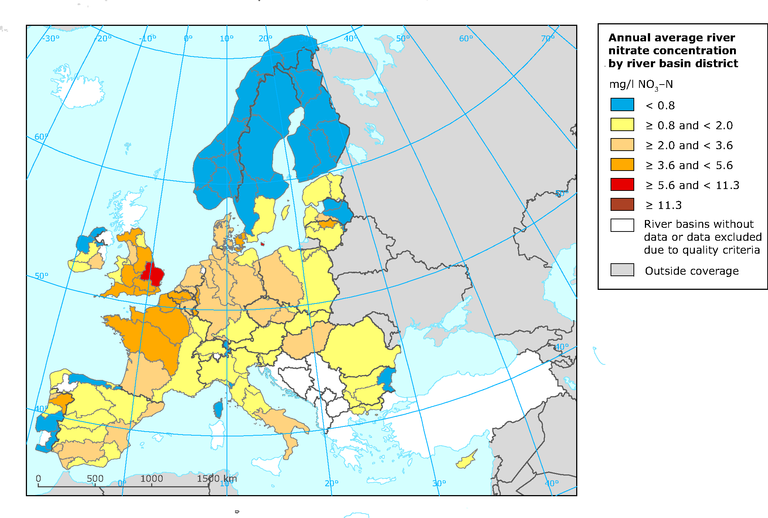
This map shows the mean annual concentrations of Nitrate (NO3) as mg/L NO3-N measured at Eionet-Water River monitoring stations during 2008. All data are annual means. For most countries these are based on measurements over the whole year, whereas some countries have samples only from the growing season (due to ice cover in winter)
Loading