All official European Union website addresses are in the europa.eu domain.
See all EU institutions and bodiesAn official website of the European Union | How do you know?
Environmental information systems
EN
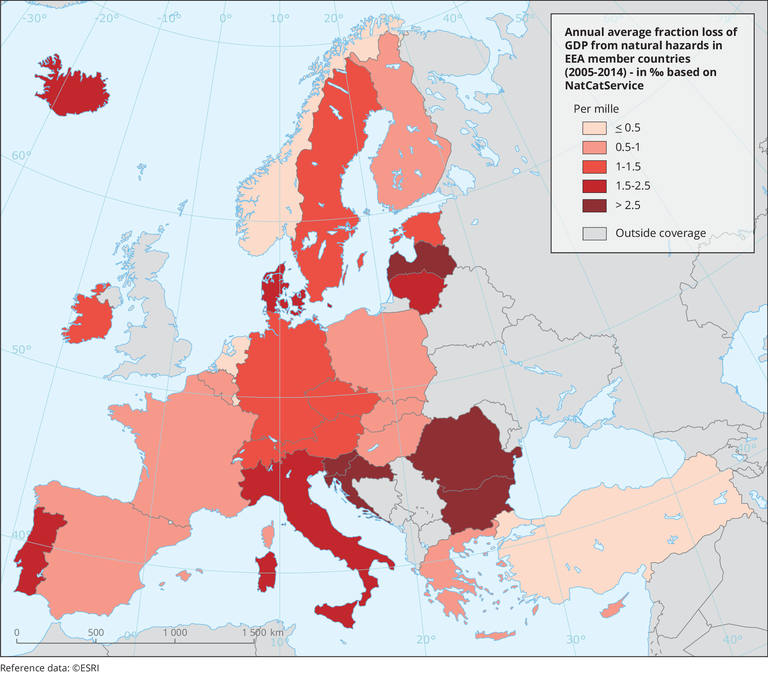
For the period 2005-2014, based on the damage records from NatCatSERVICE of Munich Re and the EUROSTAT structural indicators.
Loading