All official European Union website addresses are in the europa.eu domain.
See all EU institutions and bodiesAn official website of the European Union | How do you know?
Environmental information systems
EN
-
Loading
All official European Union website addresses are in the europa.eu domain.
See all EU institutions and bodiesChart (static)
-
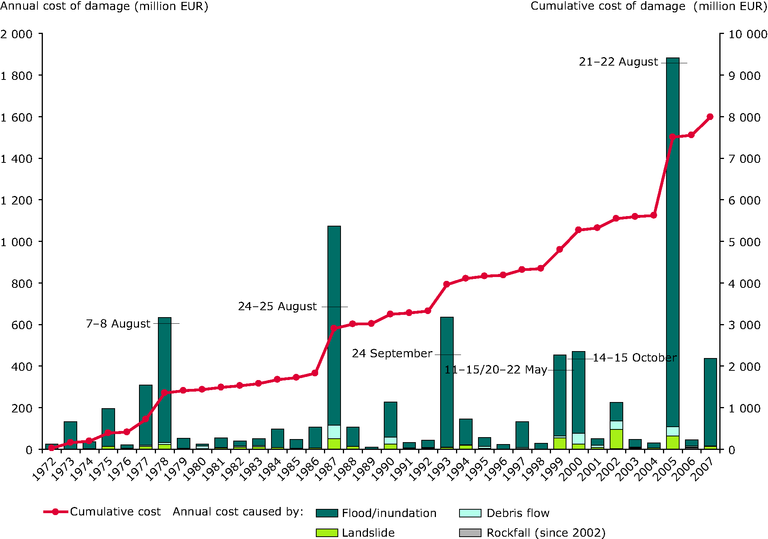
The p-value for the total cost of damage is 0.29, which indicates there is no statistically significant trend in the data.