All official European Union website addresses are in the europa.eu domain.
See all EU institutions and bodiesAn official website of the European Union | How do you know?
Environmental information systems
EN
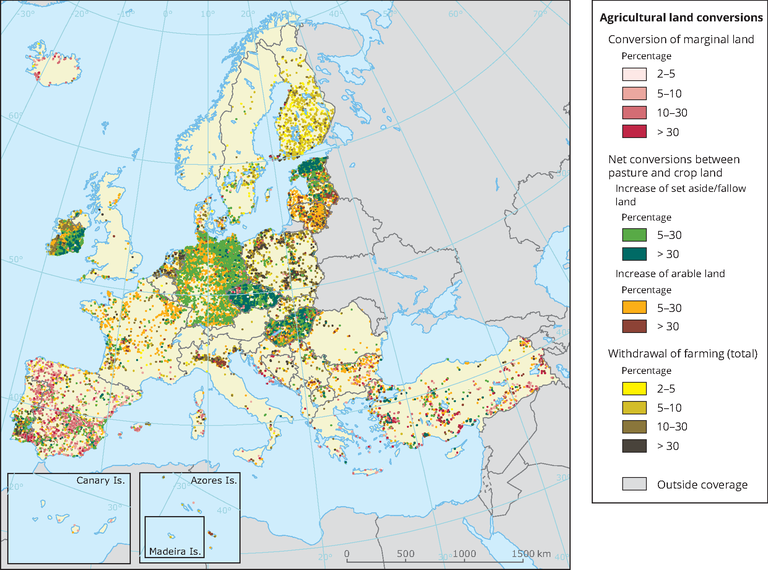
This map shows spatial distribution and intensity of main agricultural conversions (lcf52 Conversion from semi-natural land to agriculture, lcf41 Extension of set aside fallow land and pasture, lcf46 Conversion from pasture to arable and permanent crops and lcf6 Withdrawal of farming) over the territory in period 2006 - 2012.
Loading