All official European Union website addresses are in the europa.eu domain.
See all EU institutions and bodies
An official website of the European Union | How do you know?
Environmental information systems
EN

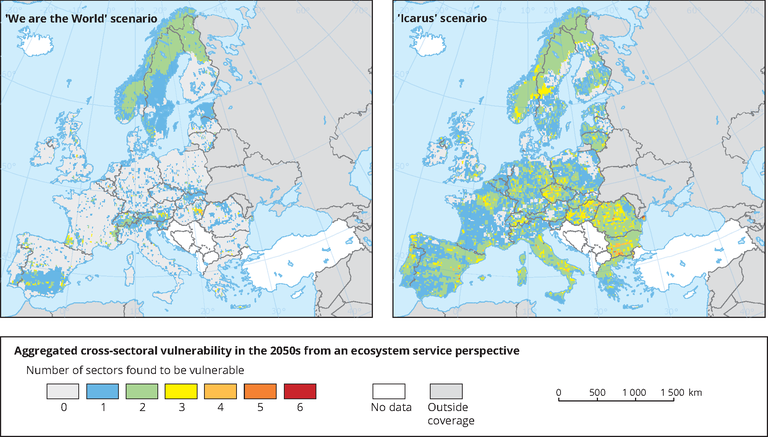
The map is based on gridded data and shows multi-sectoral vulnerability from an ecosystem service assessment perspective.
Loading