All official European Union website addresses are in the europa.eu domain.
See all EU institutions and bodiesAn official website of the European Union | How do you know?
Environmental information systems
EN
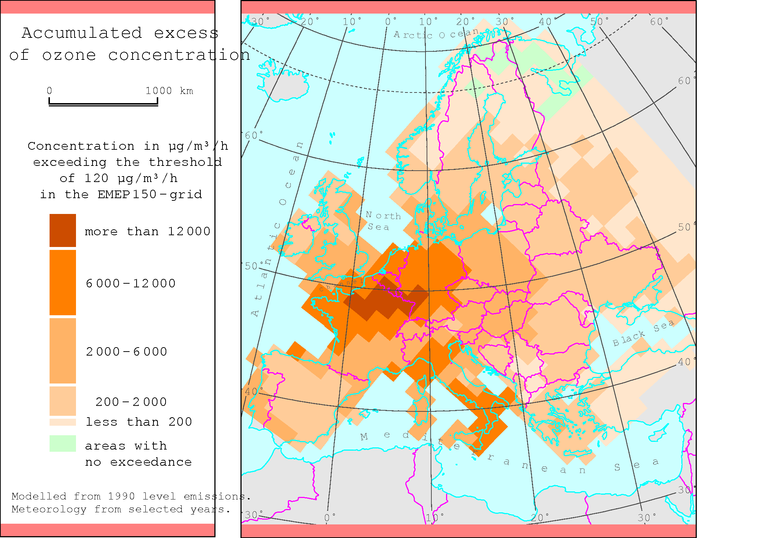
Almost the entire population of Europe is exposed to ozone levels exceeding the WHO guideline for protection of human health
Loading