All official European Union website addresses are in the europa.eu domain.
See all EU institutions and bodies
An official website of the European Union | How do you know?
Environmental information systems
EN

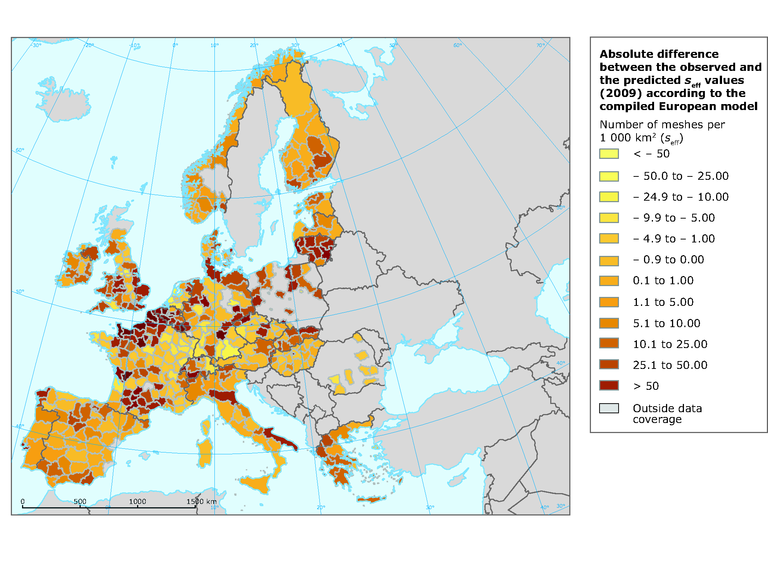
Map shows the differences between the level of fragmentation for FG-B2 calculated and the level of fragmentation predicted by 6-group-European model in the 28 countries investigated
Loading