All official European Union website addresses are in the europa.eu domain.
See all EU institutions and bodiesAn official website of the European Union | How do you know?
Environmental information systems
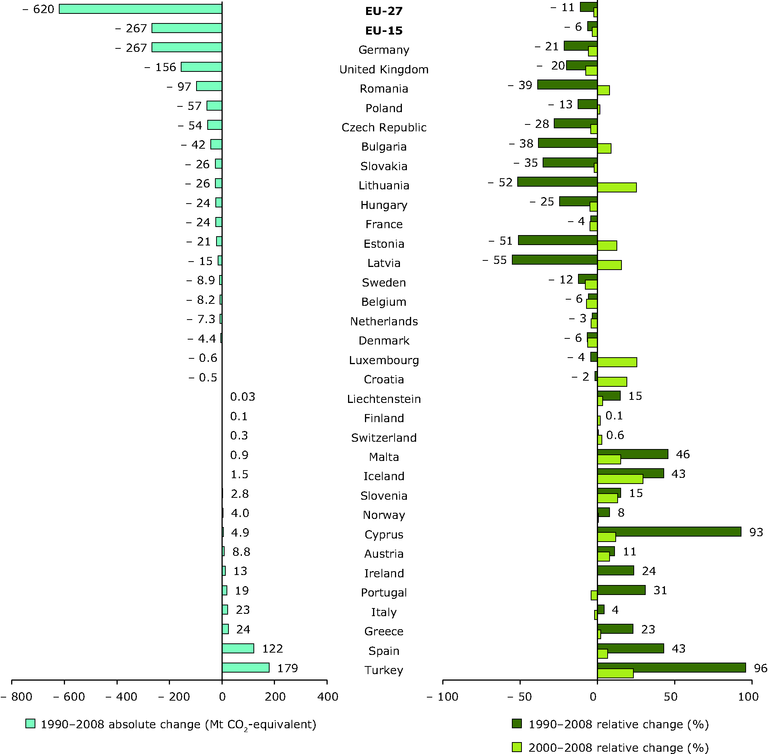
Absolute change and average annual relative change of total GHG emissions in the EU, 1990-2008
Chart (static)
-

Downloads
Data sources
Metadata
More info
Loading
- Greece
- Poland
- Romania
- Portugal
- Spain
- United Kingdom
- Netherlands
- Belgium
- Germany
- France
- Czechia
- Italy
- Cyprus
- Estonia
- Latvia
- Lithuania
- Finland
- Hungary
- Bulgaria
- Malta
- Denmark
- Sweden
- Austria
- Luxembourg
- Ireland
- Slovakia
- Slovenia
1990-2008
