All official European Union website addresses are in the europa.eu domain.
See all EU institutions and bodiesAn official website of the European Union | How do you know?
Environmental information systems
EN
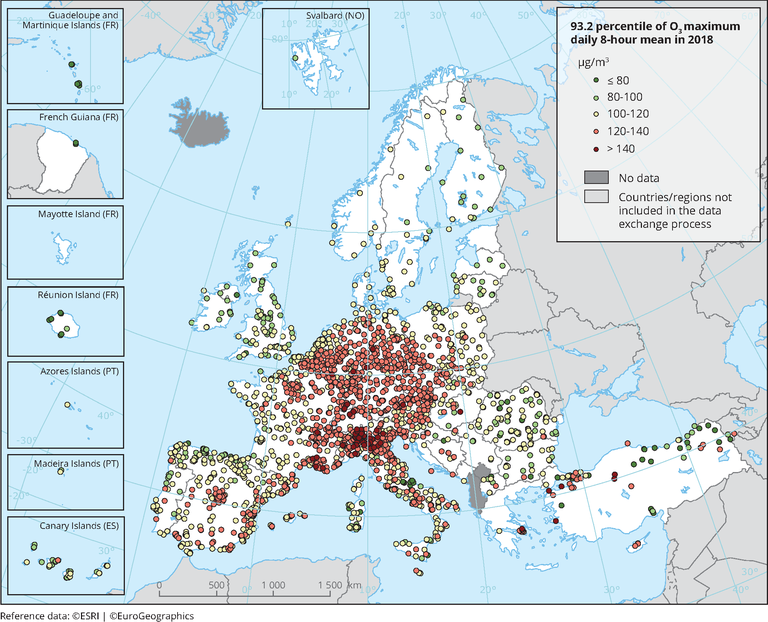
Observed concentrations of O3 in 2018. The map shows the 93.2 percentile of the O3 maximum daily 8-hour mean, representing the 26th highest value in a complete series. It is related to the O3 target value. At sites marked with dots in the last two colour categories, the 26th highest daily O3 concentrations were above the 120 μg/m3 threshold, implying an exceedance of the target value threshold. Please note that the legal definition of the target value considers not only 1 year but the average over 3 years. Only stations with more than 75 % of valid data have been included in the map.
Loading