All official European Union website addresses are in the europa.eu domain.
See all EU institutions and bodiesAn official website of the European Union | How do you know?
Environmental information systems
EN
- БългарскиBG
- češtinaCS
- HrvatskiHR
- danskDA
- NederlandsNL
- ελληνικάEL
- EnglishEN
- eestiET
- SuomiFI
- FrançaisFR
- DeutschDE
- magyarHU
- ÍslenskaIS
- italianoIT
- LatviešuLV
- lietuviųLT
- MaltiMT
- NorskNO
- polskiPL
- PortuguêsPT
- RomânăRO
- slovenčinaSK
- SlovenščinaSL
- EspañolES
- SvenskaSV
- TürkçeTR
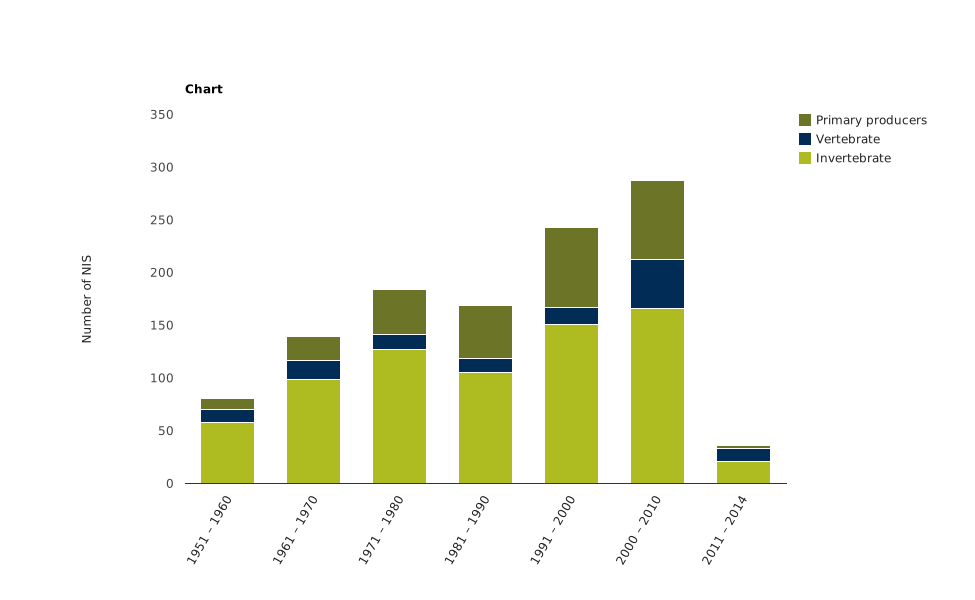
Rate of introduction of marine non-indigenous species
Chart (static)
Note: This figure shows the number of new introductions of marine Non-Indigenous Species (NIS). Analysis is made at Pan-European level and shown per decade. The most recent period only covers 2011 to 2014.
Downloads
Data sources
Metadata
More info
- Rate of introduction of NIS in European Seas, Hellenic Centre for Marine Research (HCMR)
, Algeria, Egypt, Israel, Lebanon, Libya, Marine Baltic sea, Marine Black sea, Marine Mediterranean sea, North Atlantic Ocean, Morocco, Palestine, Syria, Tunisia
1951-2014