All official European Union website addresses are in the europa.eu domain.
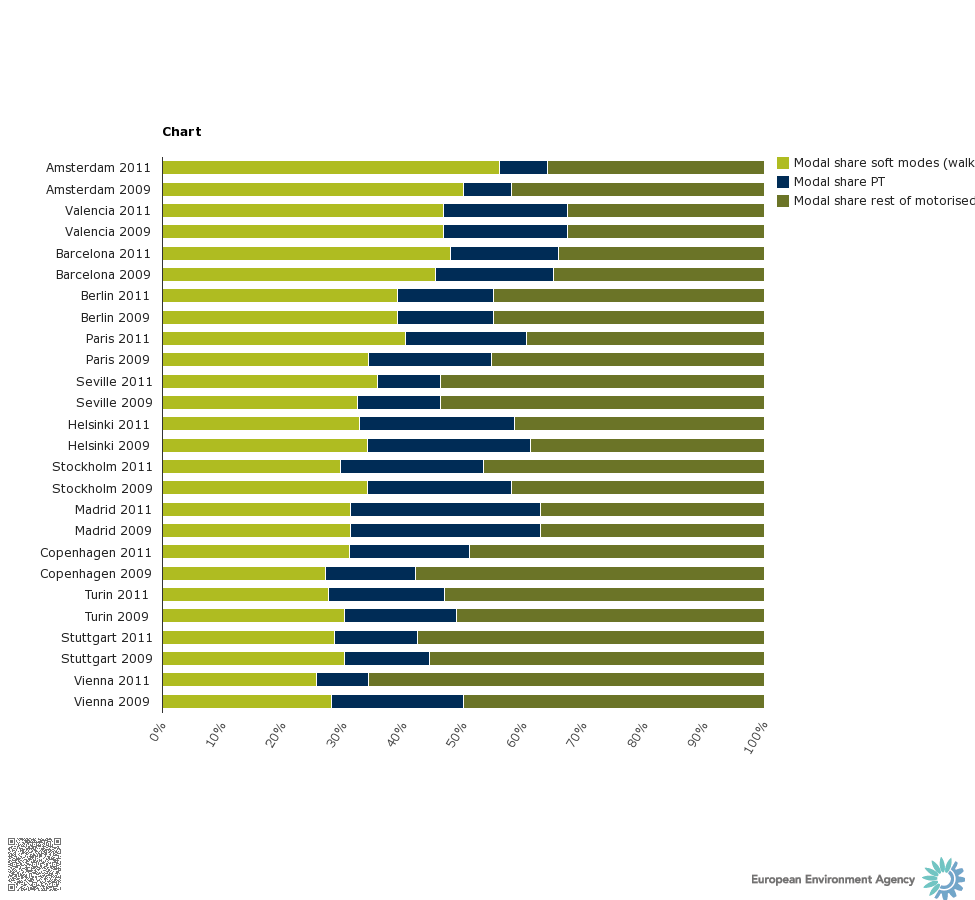
Chart (static)Published 15 Apr 2014Modified 20 Sept 2024
Note:- PT: Public Transport.