|
Indicator
|
EU indicator past trend
|
Selected objective to be met by 2020
|
Indicative outlook of the EU meeting the selected objective by 2020
|
|
Share of renewable energy in gross final energy consumption
|

|
Reach a 20% share of renewable energy in gross final energy consumption - Renewable Energy Directive
|
 |
|
The EU has steadily increased the share of renewable energy in its gross final energy consumption. If the current pace of growth is maintained, the 2020 renewable energy target will be met
|
For further information on the scoreboard methodology please see Box I.1 in the EEA Environmental indicator report 2016
Setting the scene
The 7th EAP supports the EU’s objective of meeting its 2020 renewable energy target, as stipulated in the Renewable Energy Directive (EU, 2013). In comparison with fossil fuels, using renewable energy results in reduced greenhouse gas and air pollutant emissions, reduced environmental and health impacts, and a reduced dependency on energy imports.
Policy targets and progress
The Renewable Energy Directive (EU, 2009) commits the EU to reaching 20 % of renewable energy in gross final energy consumption by 2020. It sets binding national targets for renewable energy consumption in 2020 and it prescribes for each Member State minimum indicative trajectories in the run-up to 2020 to ensure that national targets will be met.
The Directive also requires Member States to adopt national renewable energy action plans that outline expected trajectories for the national share of renewable energy sources (RES) from 2010 to 2020. It also requires Member States to report every 2 years on progress towards the indicative trajectories of the Directive as well as towards the trajectories that they have set themselves in their action plans.

Note: Share results 2014
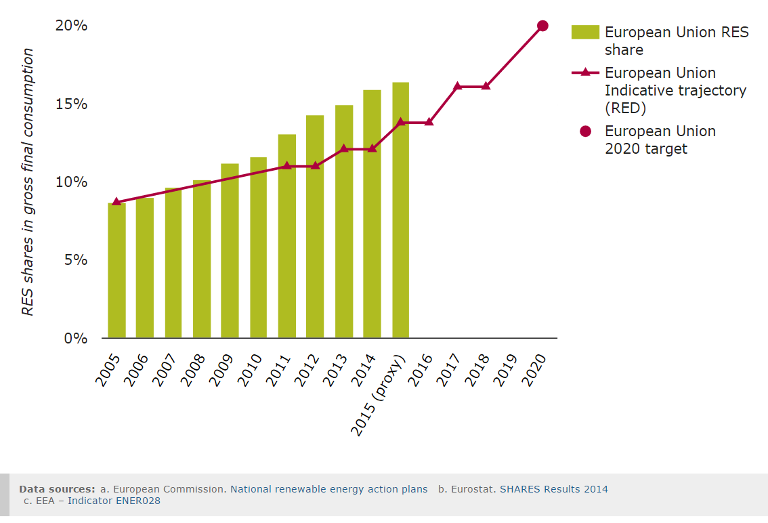
As can be seen in Figure 1, the proportion of renewable energy increased continuously between 2005 and 2014, with an annual compound growth rate of 7 %, to reach 15 % in 2013 and 16 % in 2014 (EEA, 2015a). This has put the EU well on the path to meeting its target. The increase has been more rapid than the target path. The increase was mainly the result of various support schemes that were put in place by Member States, such as feed-in tariffs, feed-in premiums, auction/tender systems, quotas, tax credits and grants.
Shrinking production costs due to the scaling up of global production volumes and technological advances have also played an important role (EC, 2015). Photovoltaics (technologies that transform solar energy to electricity) have experienced the largest reduction in costs, with costs per kilowatt hour decreasing by 53 % between 2010 and 2014 (UNEP, 2014). Electricity from onshore wind turbines became 15 % cheaper during the same period (UNEP, 2014). Lower final energy consumption has also helped the EU to increase its renewable energy share (see EEA, 2016, and the EEA’s final energy consumption indicator, CSI 027) because, if final energy consumption is lower, a lower overall quantity of energy is required from renewables to meet the target.
If Member States fully deliver on their national renewable energy action plans, the EU will slightly over-achieve its target (by about 1 percentage point) (EEA, 2015b). Wind power, solar electricity and biofuels for transport are expected to have the highest growth rates to 2020 (UNEP, 2014). This was also the case during the 2005–2014 period, in particular with respect to wind and solar electricity. In absolute terms, however, hydropower and biomass (for heat generation) will remain the most important single RES, despite a decrease in their contribution to the overall energy produced by renewable sources. In 2012, hydropower accounted for 17 %, and biomass and waste for 64 %, of final renewable energy consumption.
While EU countries still lead the world in total installed renewable capacity, the EU is losing ground to China, Japan and the United States with respect to new installations (EEA, 2016). The EU was the region with the highest RES investments every single year from 2005 to 2012, surpassed by China only in 2013 (UNEP, 2014); this shows that the EU played a leading role in the development of renewables in their early stage, and for the global roll-out of RES. Of world regions with sufficient data availability, the EU came third in per capita employment in the area of renewable energy in 2014 (EEA, 2016). However, in 2013, EU investment in renewables slumped by 44 % compared with the previous year. This reflected not only lower costs but also uncertainty about the future of support mechanisms and lower investment capacity due to the persistent economic downturn in some EU countries (UNEP, 2014). Feed-in tariffs, an effective renewable energy support scheme, were drastically cut in 2012 and 2013 in some Member States. In some cases these changes were applied retroactively, i.e. to existing plants (EC, 2015). Policy uncertainty increases the costs of renewable energy installation and makes Europe a less attractive prospect for investors and renewable energy developers (UNEP, 2014). This has already been observed in the solar power industry. The strong growth in the renewable energy sector in Europe is picked up in the Environmental goods and services sector briefing (AIRS_PO2.12)1 and the Environmental protection expenditure briefing (AIRS_ PO2.13).2
Given this context, further action from Member States may be required to ensure that the EU remains on the path to the 2020 target. A number of European governments have introduced measures such as premiums on spot market prices, competitive tenders or capacity-dependent feed-in tariffs to help protect and increase the market penetration of renewable energy operators (EC, 2015a). In 2014, the European Commission published guidelines on state aid for environmental protection and energy for the period up until 2020 (EC, 2014), which, inter alia, should contribute towards a more harmonised approach to supporting renewable energy growth across the EU.
Country level information

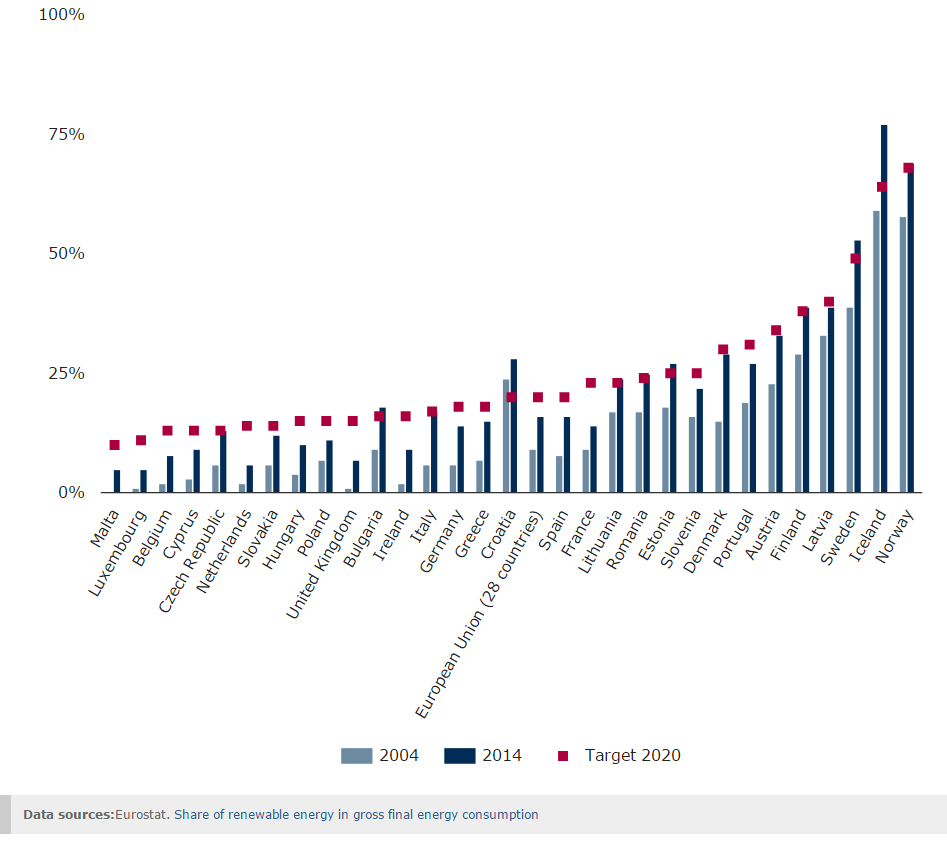
As can be seen in Figure 2, the contribution of RES to gross final energy consumption varies greatly between countries in Europe. This reflects different starting points in the deployment of renewables in each country and differences in the availability of natural resources to produce renewable energy. It also reflects, to some extent, differences in policies to stimulate renewables. Between 2004 and 2014, 12 EU countries at least doubled their renewable energy shares and Bulgaria, Croatia, the Czech Republic, Estonia, Finland, Italy, Lithuania, Romania and Sweden have already reached their targets for 2020.
The countries that are the furthest from their targets are the United Kingdom, the Netherlands and France (EEA, 2015b). As they account for about one third of the EU’s final energy consumption, their progress in the deployment of renewable energy will play an important role in the prospects of the EU meeting its overall target.
Outlook beyond 2020
Additional deployment of RES beyond 2020 is vital if the EU is to achieve its aim of reducing its greenhouse gas emissions by 80 – 95 % by 2050 compared with 1990 levels — an aim that is key to the 7th EAP’s long-term vision of low-carbon growth decoupled from resource use well before 2050. EU countries have already agreed on a new, EU-wide renewable energy target of at least 27 % of gross final energy consumption by 2030. The continued effort to expand renewable energy in the EU will also be a key element of the Energy Union strategy (EC, 2015b), which aims to ensure secure, sustainable and affordable energy supply for all EU citizens. Challenges for further progress in renewable energy are the expansion of the grid infrastructure to include a growing share of often decentralised RES, the increase of flexibility options in the system to accommodate a growing share of intermittent renewable technologies (e.g. through the development of demand-side management and energy storage options), and the sustainable sourcing and use of biomass (including biofuels).
About the indicator
This indicator is defined as the share of renewable energy in gross final energy consumption. Gross final energy consumption is defined as ‘energy commodities delivered for energy purposes to industry, transport, households, services including public services, agriculture, forestry and fisheries, including the consumption of electricity and heat by the energy branch for electricity and heat production and including losses of electricity and heat in distribution and transmission’ (EU, 2009) . The indicator includes the contribution of renewable sources to all of the final uses of energy (electricity, transport, and heating and cooling). RES include wind, solar, aerothermal, geothermal, hydro, ocean energy sources, biomass and the biodegradable fraction of waste.

Document Actions
Share with others