The graph presents the unit consumption of steel, paper and cement for the year 2008, instead of the most recent year (2009), as 2009 was year of deep recession in these industries, the specific consumption is not representative.
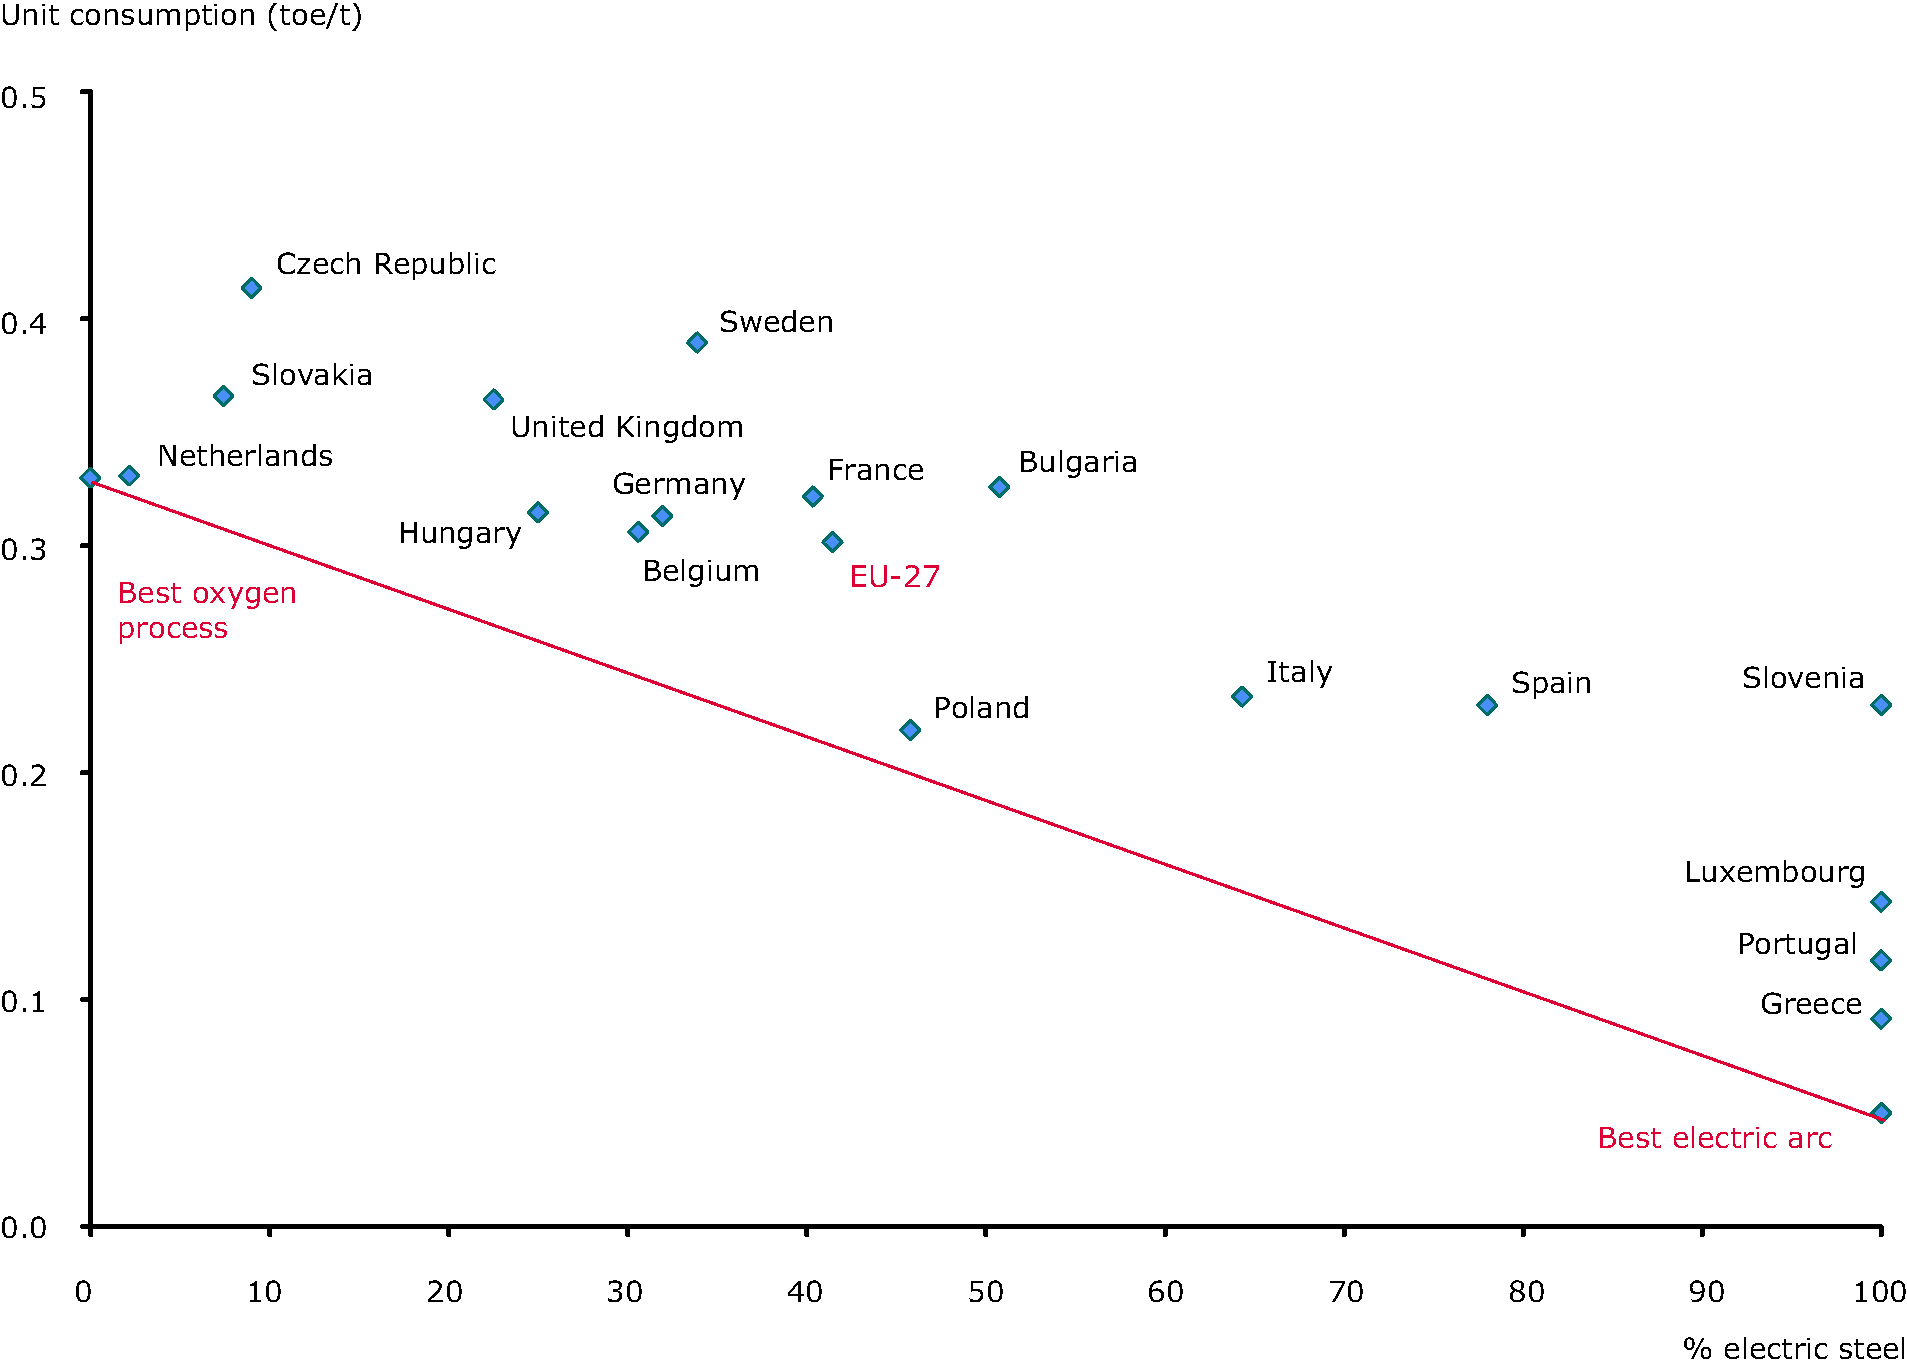
Graphs based on the specific consumption of steel:
UC = C / PP
with
UC : specific consumption in toe/t
C : energy consumption in Mtoe (source Odyssee database)
PP : physical production in tons (source Odyssee database)
For all the EU countries, data are extracted from the ODYSSEE database (last update in August 2009); Source of data : national data
For EU, the data sources are the following:
- Energy consumption : source Eurostat except for:
- Wood (NCE 20): source Enerdata / IEA
- Construction (NCE 45): source Enerdata / IEA
- Machinery (NCE 28-32) and transport vehicles (NCE 34-35) [in Eurostat energy consumption for these 2 branches are given together] for ODYSSEE this overall consumption has been split into 2 sub branches according to the desagregation given in the Enerdata ‘ s database (coherent with IEA)
- Other branches : in Eurostat this residual branch includes also construction , wood; for ODYSSEE energy consumption of this branch has been recalculated as total industry minus sum of the energy consumption of the branches
- Intensive branches:
- Cement : physical production for EU is the sum of the production of the 27 countries (source Odyssee). Energy consumption : based on the energy consumption of 12 countries : UK, Sweden, Spain, Portugal, Netherlands, Italy, Greece, France, Germany and Belgium, Poland and Hungary (source Odyssee) – the consumption for EU-27 as a whole is extrapolated, based on the EU12 consumption weighted by the ratio (production EU-27/production EU-12)
- Paper : physical production for EU-27 is the sum of EU-27 countries (source Odyssee). Energy consumption : source Eurostat
- Steel : physical production for EU-27 is the sum of EU-27 countries (source IISI). Energy consumption : source Eurostat


Document Actions
Share with others