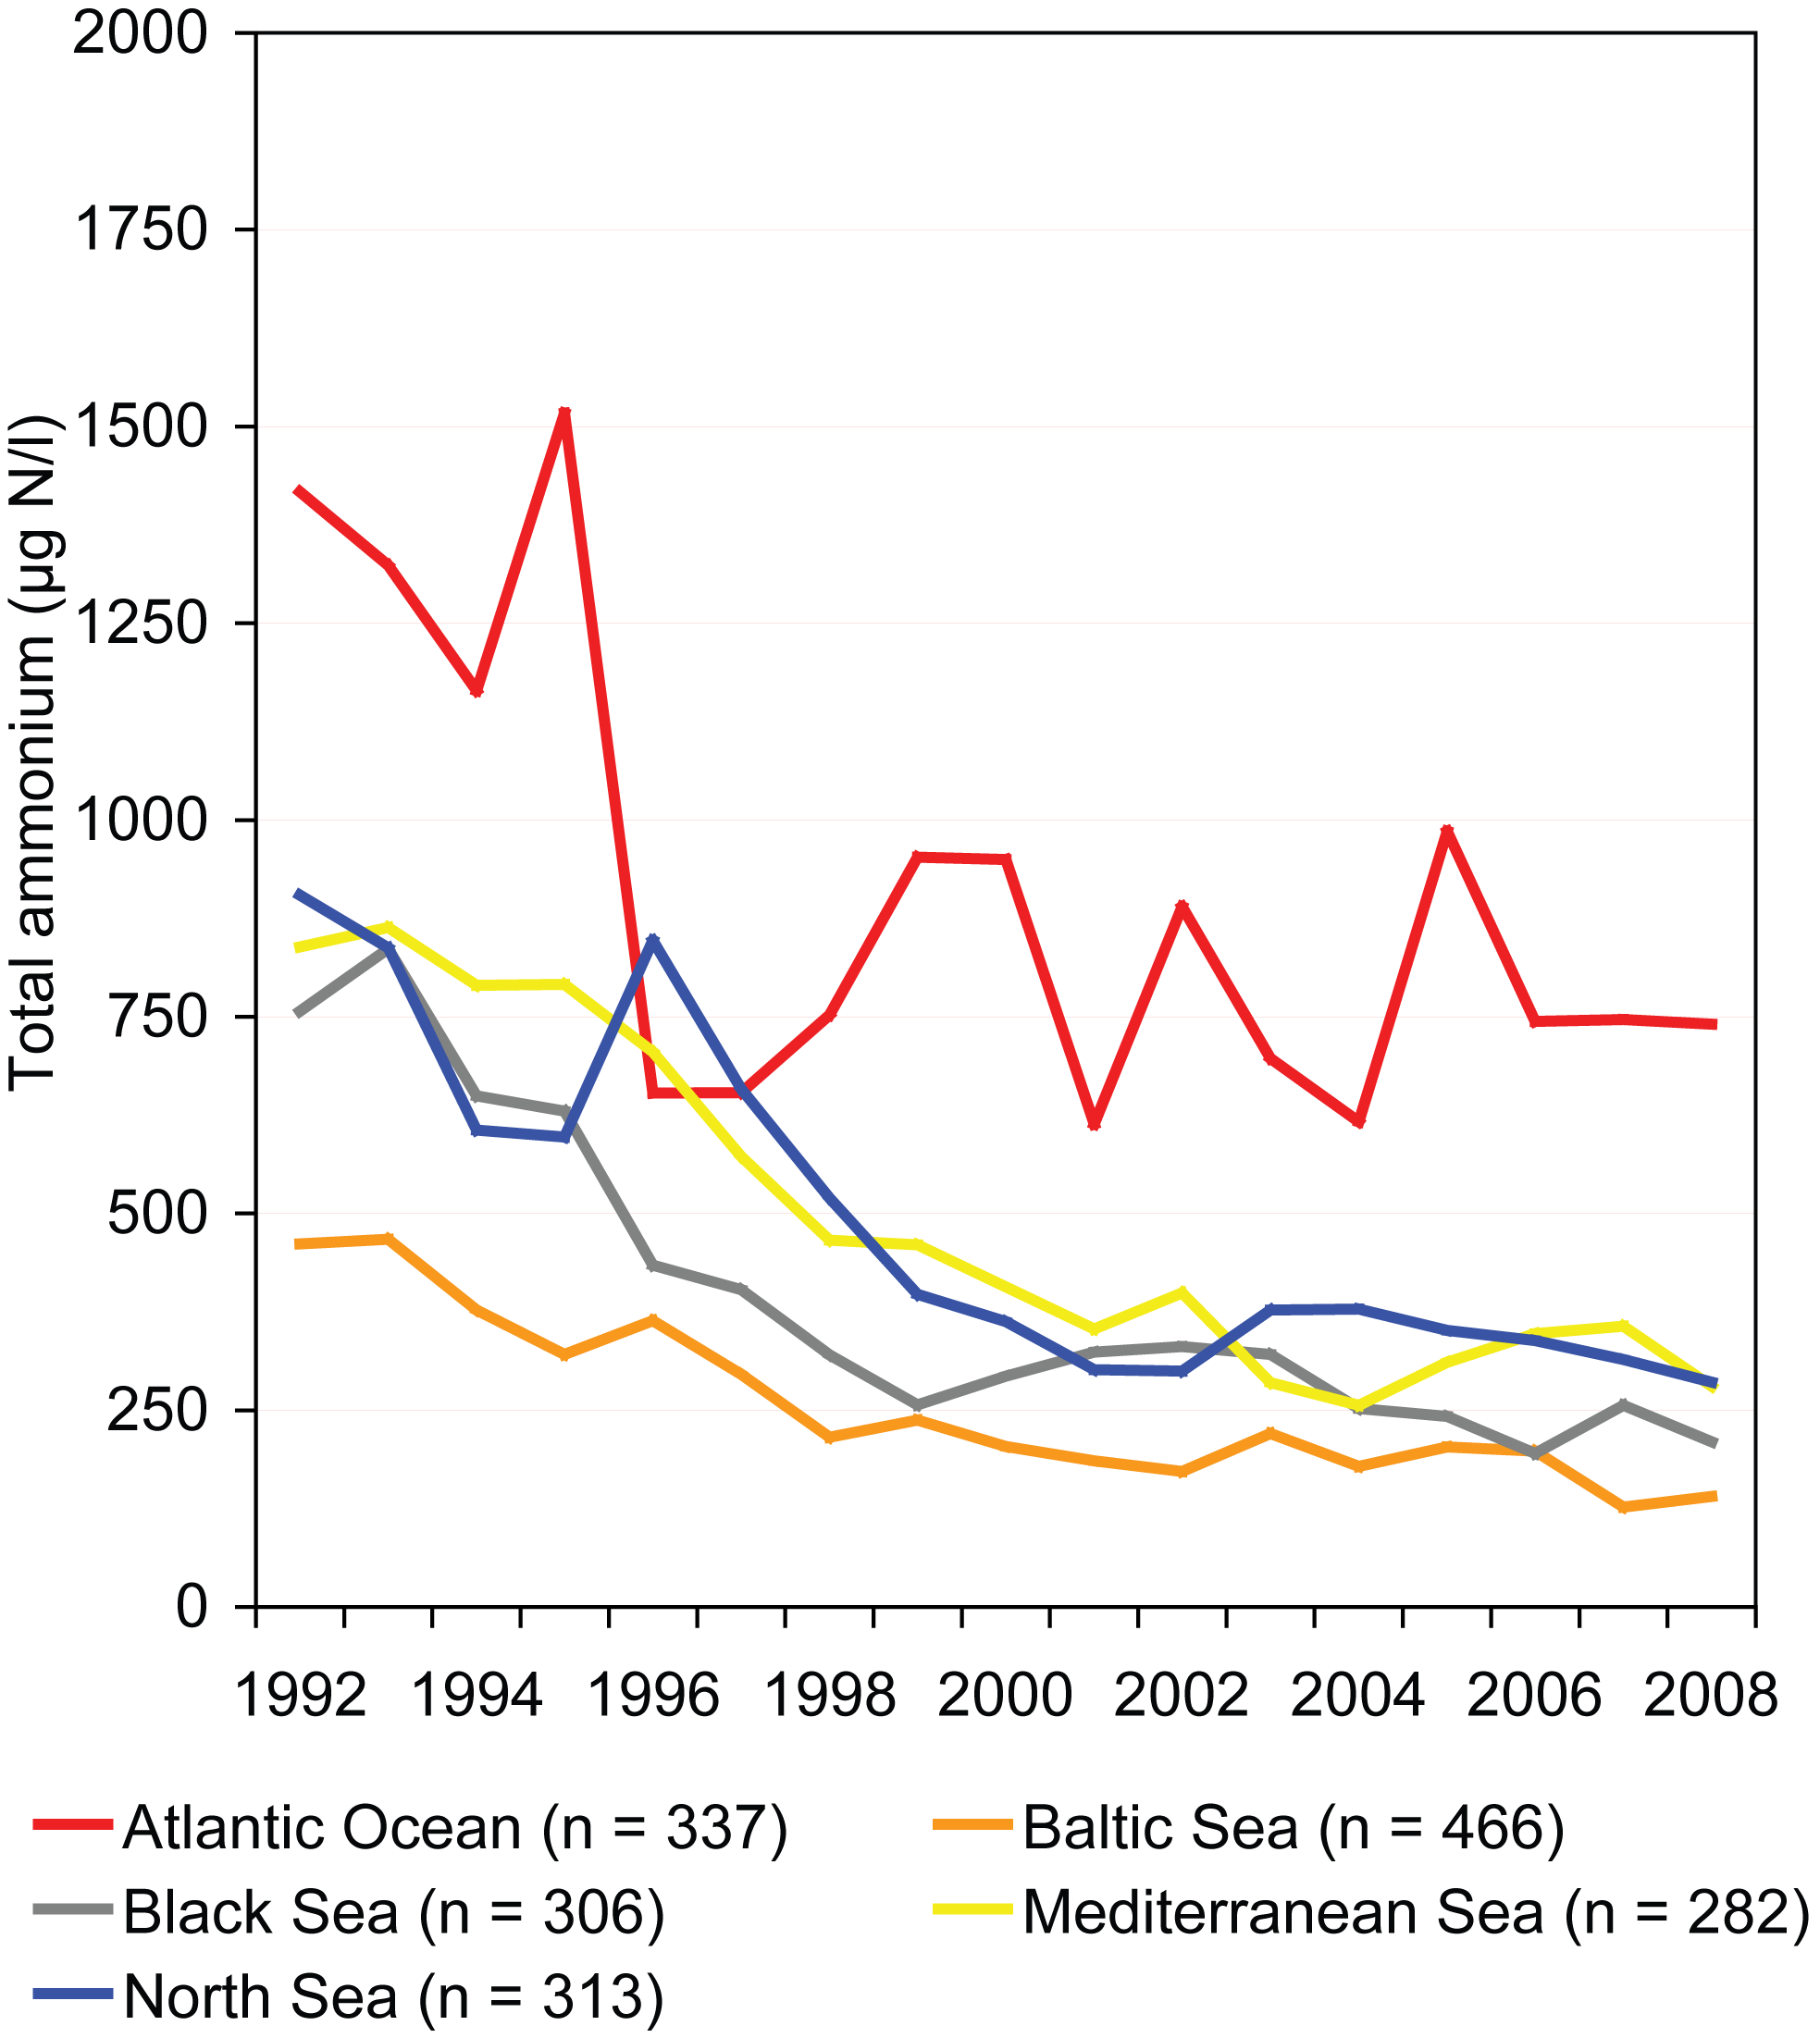
Concentrations are expressed as the average of annual mean concentrations. Up to 3-year gaps of missing values have been interpolated or extrapolated. Only complete series with no missing values after this interpolation/extrapolation are included. Number of river monitoring stations included in analysis per region and country within the corresponding region is noted in brackets. Two regions with few stations are not shown in the graph (Barents Sea: 1 station, Norwegian Sea: 2 stations). These stations have concentrations below 15 µg N/l since 2000 (5 and 3 µg N/l, respectively in 2008).
Atlantic Ocean (337): Spain (205), France (127), Ireland (5);
Baltic Sea (466): Germany (11), Estonia (53), Finland (152), Lithuania (28), Latvia (39), Poland (105), Sweden (78);
Barents Sea (1): Norway (1);
Black Sea (306): Austria (134), Bulgaria (39), Germany (18), Hungary (98), Slovenia (17);
Mediterranean Sea (282): Albania (9), Bulgaria (41), Spain (151), France (65), FYR of Macedonia (9), Slovenia (7);
North Sea (313): Austria (11), Belgium (32), Germany (118), France (93), United Kingdom (14), Luxembourg (3), Norway (7), Sweden (35);
Norwegian Sea (2): Norway (2).


Document Actions
Share with others