Personal tools

Sign up now!
Get notifications on new reports and products. Currently we have 58471 subscribers. Frequency: 3-4 emails / month.
Follow us
Twitter icon Twitter
Facebook icon Facebook
YouTube icon YouTube channel
RSS logo RSS Feeds
Notifications archive

Write to us Write to us

For the public:


For media and journalists:

Contact EEA staff
Contact the web team
FAQ

Call us Call us

Reception:

Phone: (+45) 33 36 71 00
Fax: (+45) 33 36 71 99


next
previous
items

Skip to content. | Skip to navigation

Sound and independent information
on the environment

You are here: Home / Data and maps / Maps and graphs / Trend in yearly cumulated melting area of the Greenland ice sheet

Trend in yearly cumulated melting area of the Greenland ice sheet

Created : Jun 12, 2012 Published : Jun 14, 2012 Last modified : Nov 29, 2012 12:30 PM
Topics: ,
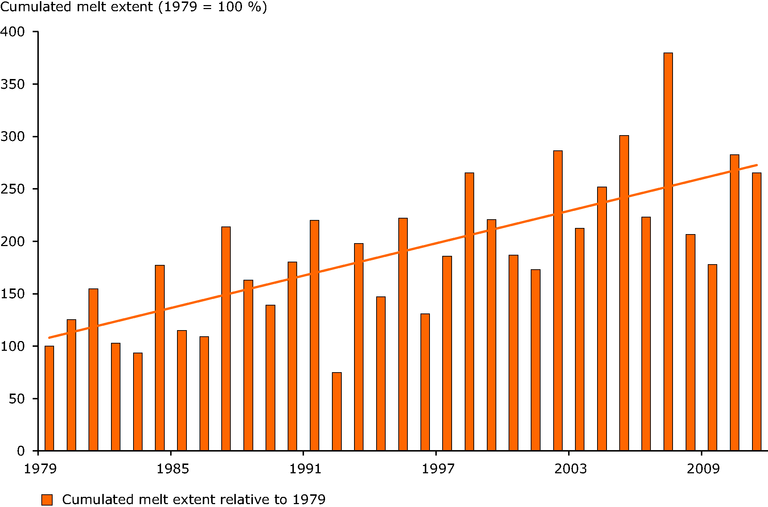
The figure shows the change in yearly cumulated area of the Greenland ice sheet and it's melt during the period 1979 to 2011 in percentage relative to area in 1979=100. The linear trend 1979–2011 is included.
This is the latest published version. .

Download

European data

Metadata

European Environment Agency (EEA)
Kongens Nytorv 6
1050 Copenhagen K
Denmark
Phone: +45 3336 7100