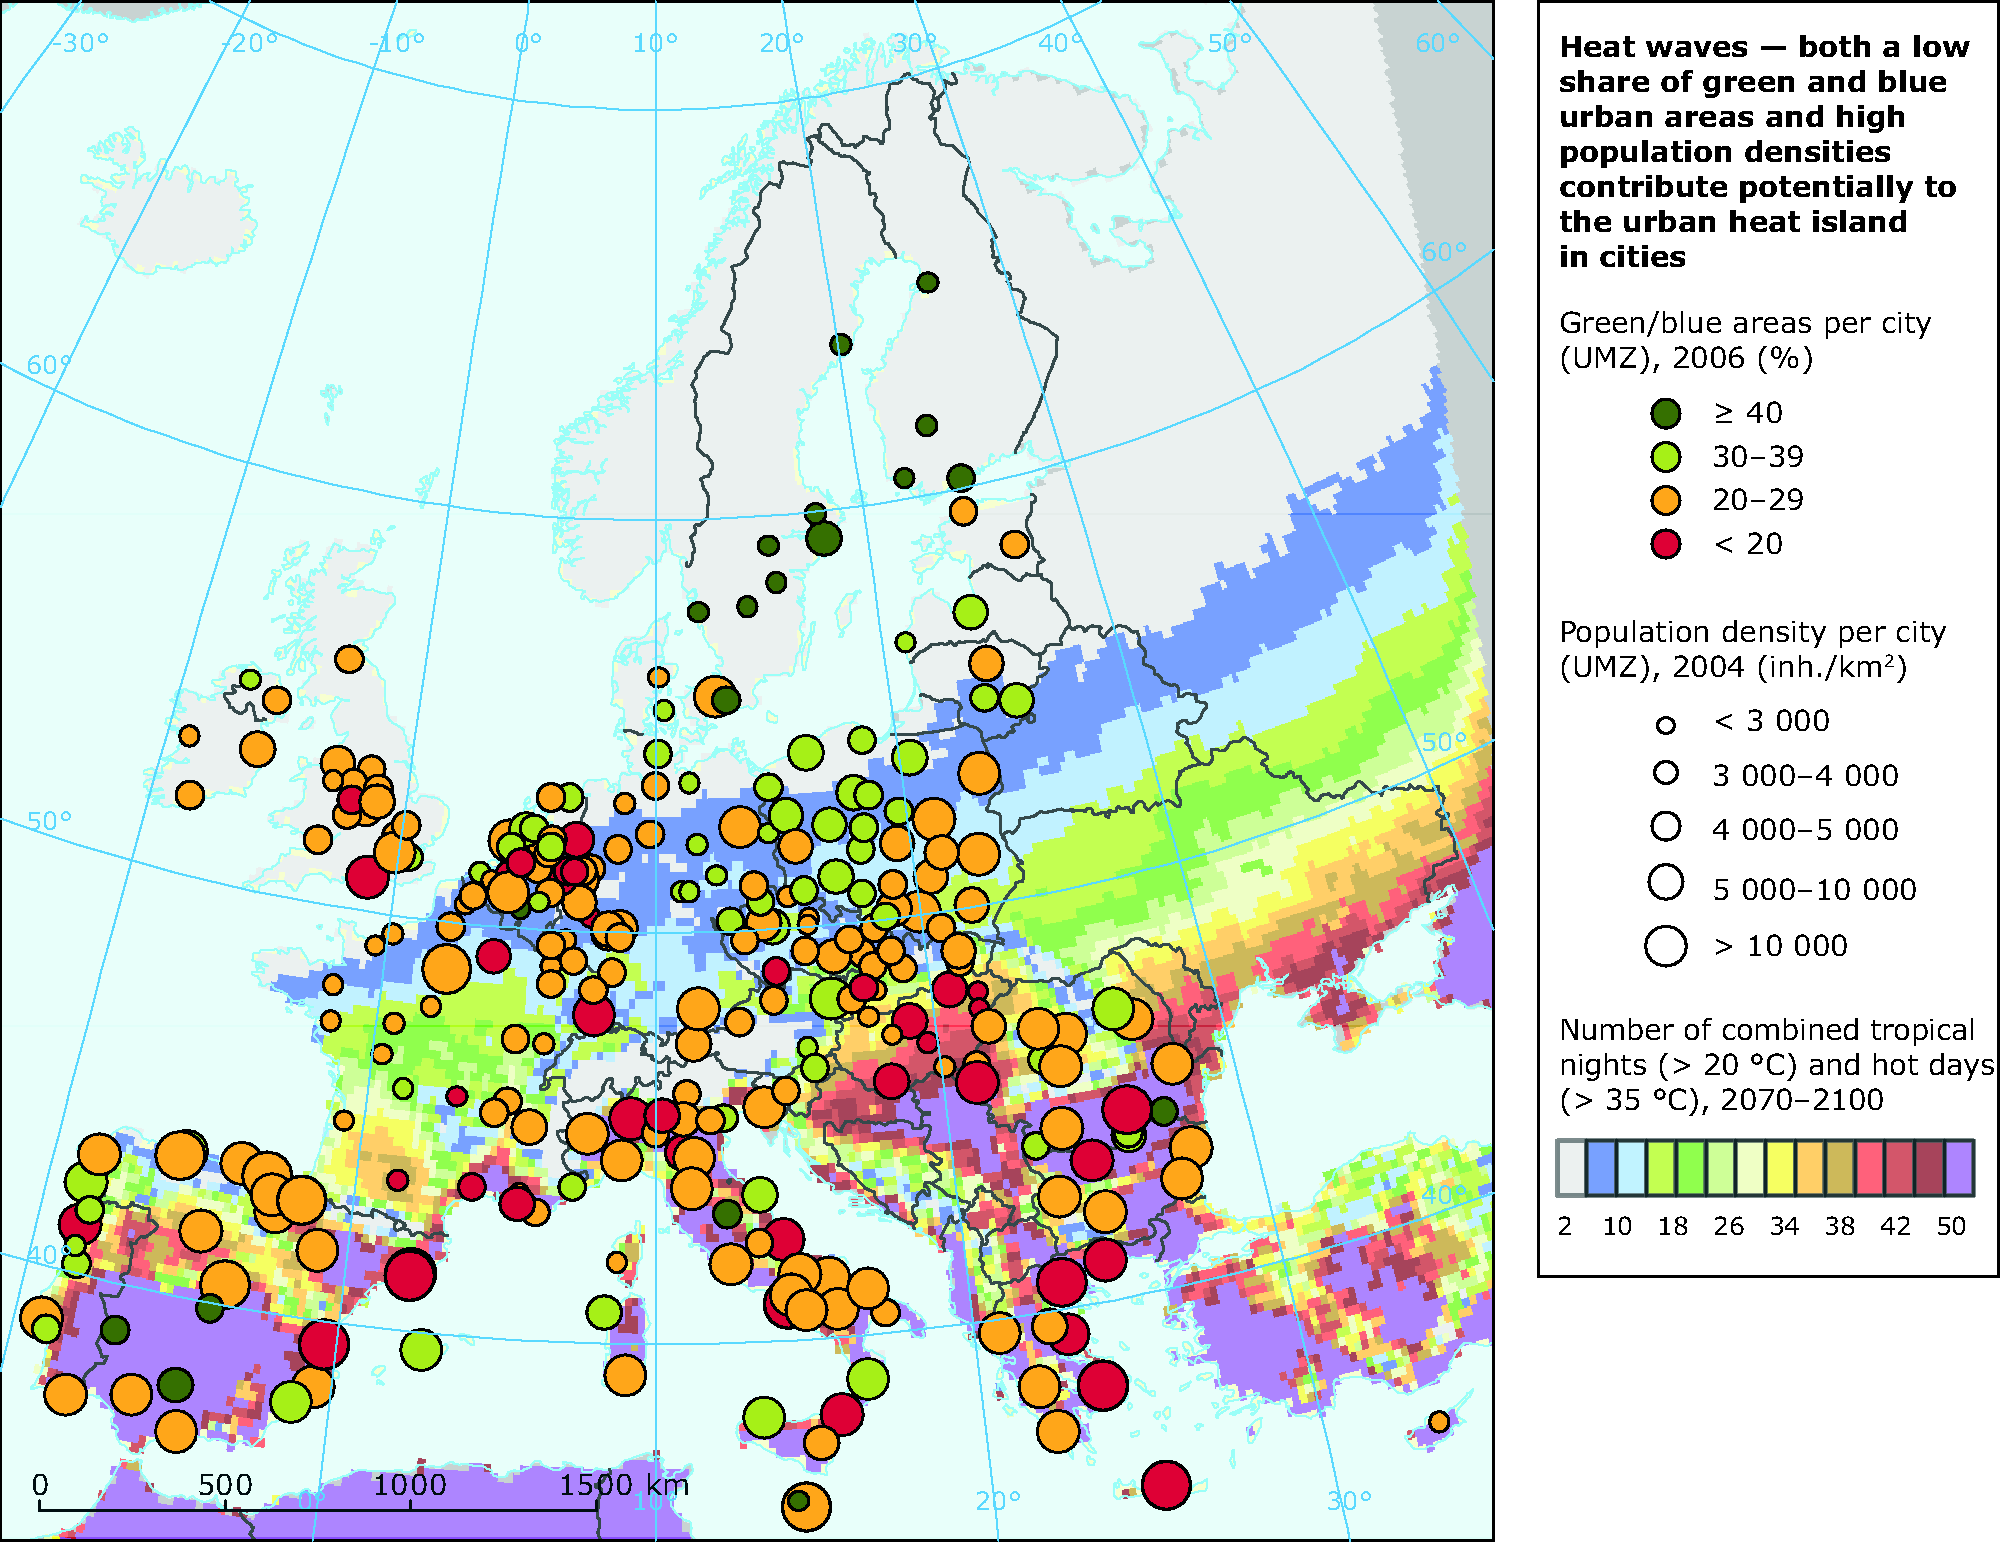
Green (vegetated) and blue (water) urban areas have been extracted from the Urban Atlas product, i.e. values for 369 core cities are available. The considered area is the UMZ inside the core city area (defined in Urban Atlas). The selection of classes contained in the green and blue urban areas is based on their relevance for the Urban Heat Island effect. The following selection has been made, all classes marked in green are components of the green and blue urban areas:
|
CODE
|
Urban Atlas classes
|
|
11230
|
Discontinuous Low Density Urban Fabric (S.L. : 10% - 30%)
|
|
11240
|
Discontinuous Very Low Density Urban Fabric (S.L. < 10%)
|
|
14100
|
Green urban areas
|
|
14200
|
Sports and leisure facilities
|
|
20000
|
Agricultural areas, semi-natural areas and wetlands
|
|
30000
|
Forests
|
|
50000
|
Water bodies
|
Those classes were extracted from the Urban Atlas, their area summed up and its share in relation to the total area of the city (core city-UMZ) calculated. For the map production the values were classified into 4 classes and presented as coloured dots on the map.
The population statistics (total population) have been exported from the Urban Audit database for the reference year 2004 (IE and BG data are from 2001), reprocessed to reflect core city-UMZ related population densities and mapped as dots of different sizes.


Document Actions
Share with others