Indicator 2: Air emissions
| CO2 emissions from transport
in the EU increased by 41 % between 1985 and 1996. If this trend persists,
it will jeopardise the EU meeting its targets under the Kyoto Protocol.
NMVOC and NOx emissions have been
falling since 1990, mainly due to the increased use of exhaust catalysts.
However, this has been partly offset by the large growth in traffic volumes.
Meeting the targets of the European Commission. s 1999 proposal for a Directive
on national emission ceilings would require further emission decreases.
Figure1.4: CO2 emissions by transport
mode (EU15)
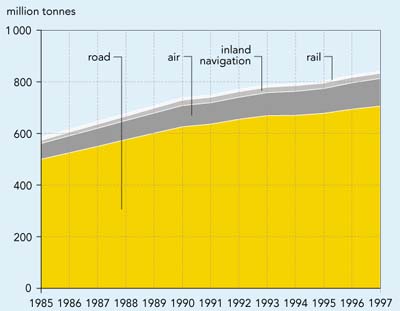
Source:
Eurostat
Objective
- Meet international emission-reduction targets
(see Table 1.1).
Definition
- Annual air emissions of carbon dioxide (CO2),
nitrogen oxides (NOx), non-methane volatile organic compounds
(NMVOCs) and sulphur dioxide (SO2).
|
Policy and targets
Air emissions from transport contribute significantly
to climate change, acidification, photochemical pollution (ground-level ozone)
and poor urban air quality. Airborne pollutants have serious adverse effects
on human health and ecosystems, and damage building materials.
At the international level, three Conventions are in
place to curb climate change, acidification, eutrophication and air pollution
from human activities, including transport:
- The Kyoto Protocol, under the United Nations Framework
Convention on Climate Change (UNFCCC). Industrialised countries agreed to
reduce their emissions of six greenhouse gases by 5 % from 1990 levels
by 2008-2012. The EU is committed to a reduction of 8 %. In 1998 the
EU Member States agreed a system of . burden. (or . target. ) sharing, allowing
some Member States an increase in greenhouse gas emissions, while others are
committed to larger reductions than 8 %. The protocol was adopted in
1997 and has been signed by many countries but since only a few have ratified
it, it is not yet in force. The Protocol does not address greenhouse gas emissions
from international marine and air transport.
- The Convention on Long-Range Transboundary Air Pollution,
under the United Nations Economic Commission for Europe (UNECE/CLRTAP) and
parallel Community initiatives, aimed at curbing acidification, eutrophication
and ground-level ozone. Under CLRTAP several Protocols are in force for European
countries, including the EU and its Member States, requiring reductions of
emissions of SO2, NMVOCs and NOx, expressed as national
emission ceilings or percentage reductions. The EU also has set targets within
the 5EAP. In May 1999 the Commission presented a proposal for a Directive
on national emission ceilings (NECD) for the same pollutants and also for
NH3 (of which transport is not a source), which are stricter than
the current agreed targets. The proposal has not yet been adopted by the Council.
Parallel with CLRTAP, draft national emission ceilings for many European countries,
including EU Member States, were agreed in September 1999 in a new multi-pollutant
Protocol for these four pollutants. This Protocol was adopted on 1 December
1999 (UNECE, 1999). For most EU Member States the targets are less strict
than those in the proposed Directive.
- The International Convention for the Prevention of
Pollution from Ships (MARPOL): a new protocol to reduce pollution emissions
(NOx, SO2) from ships was proposed in 1997, but this
has not yet been adopted.
- Community legislation dealing with gaseous emission
standards for aircraft are based on the certification standards for CO, NOx and HC set by the International Civil Aviation Organisation (ICAO).
More stringent emission standards are currently being investigated by the
Committee on Aviation and Environmental Protection (CAEP). The Commission
has also announced its intention to complement ICAO NOx standards with other measures (CEC, 1999d).
All the international emission reduction targets in
Table 1.1 apply to total national emissions. Countries are responsible for allocating
emission reductions to sectors, such as energy, industry and transport.
Community policies to curb air pollution from road traffic
have been framed around the Auto-Oil Programme I (which is now completed) and
the Auto-Oil Programme II, with its proposed follow-up programme . Clean Air
for Europe. (CAFÉ).
At the Member State level, Austria (BMU, 1995) and the
Netherlands (VROM, 1998) have introduced emission-reduction targets for NOx
from both road and non-road transport (some 75 % reduction from 1985 levels
by 2010). Targets for the reduction of NMVOC emissions have also been adopted
(75 % reduction from 1988 levels by 2007 in both Member States. In the
Netherlands the government has also adopted a CO2 emission reduction
target for road transport (10 % by 2010 from 1986 levels).
| Table 1.1: Total EU15 air emission
reduction targets |
|
Pollutant
|
Base year
|
Target year
|
Reduction
|
|
UNFCCC
CO2
CO2 and 5 GHG 1
|
1990
1990
|
2000
2008-2012
|
stabilisation
8 %
|
|
UNECE/CLRTAP
SO22
SO25
NOx3
NOx5
NMVOCs 3
NMVOCs 5
NH3 5
|
1980
1990
1987
1990
1987
1990
1990
|
2000
2010
1994
2010
1999
2010
2010
|
62 %
75 %
stabilisation
49 %
30 %
59 %
12 %
|
|
5EAP
SO2
NOx
NMVOCs
|
1985
1990
1990
|
2000
2000
1999
|
35 %
30 %
30 %
|
|
COM (125) 99 (proposed targets) 4
SO2
NOx
NMVOCs
NH3
|
1990
1990
1990
1990
|
2010
2010
2010
2010
|
78 %
55 %
62 %
21 %
|
|
Notes:
1 The Kyoto Protocol (6 greenhouse gases: CO2,
CH4, N2O, HFCs, PFCs, SF6). The 8 %
reduction target applies to Community emissions total (Member State targets
are different, as agreed in the 1998 EU burden sharing).
2 Target of the 1994 Second Sulphur Protocol, based on a 60 %
gap closure of the exceedance of critical loads for ecosystems for sulphur
deposition. This includes different emission ceilings for each Member
State and corresponds to a 62 % emission reduction for the Community
(EU15) by 2000, from 1980 levels.
3 Targets are the same for individual EU Member States and
for the Community (EU15)
4 Targets from the European Commission. s 1999 proposal for
a national emission ceilings Directive (NECD). These are based on the
approach of closing the gap between exceedances of critical loads for
acidification and eutrophication of ecosystems and exceedances of threshold
values for ozone for human health and ecosystems. The targets are different
for each Member State (reductions presented reported here correspond to
the EU15 emission reductions).
5 Targets from the multi-pollutant Protocol, adopted in December.
The approach followed is the same as for the NECD, but for various EU
Member States the draft CLRTAP emission ceilings are less strict than
the targets in the proposed NECD (CEC, 1999a).
Source: EEA
|
Findings
CO2
Emissions of CO2 from transport
in the EU increased from 0.6 to 0.8 bn tonnes (30 %) in the period 1985-1996
(an increase from 20 to 26 % of total anthropogenic emissions). This makes
the transport sector the fastest growing source of emissions. For comparison,
the energy sector contributed 35 % of total emissions in 1996, and the
industry sector 17 %.
Road transport accounts for 85 % of all transport
CO2 emissions. Aviation is the second largest transport CO2
source (12 %). The upward trend in CO2 emissions from transport
is due to growing traffic volumes, as there has been very little change in average
energy use per vehicle-kilometre (see Indicator 20).
Figure1.5: Emissions of CO2 per sector
(EU 15)
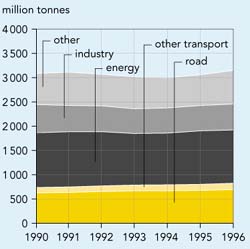
Source: Eurostat
Since the Community target for greenhouse gases under the
Kyoto Protocol cannot be allocated to CO2 only (see Table 1.1), nor
to a specific sector, it is difficult to benchmark transport CO2
emissions against this target. However, the current trends and future outlooks
are worrying. Projected EU CO2 emissions for 2010 based on the EEA.
s pre-Kyoto baseline scenario (including only policies and measures in place
in 1997) are about 8 % above the 1990 level (EEA, 1999). Emissions from
transport are forecast to increase by 39 % above the 1990 level by 2010.
This shows the need for further policies and measures to achieve the Kyoto Protocol
target, for all sectors, including transport.
NMVOCs
Emissions of NMVOCs from transport fell from
6.3 m tonnes in 1990 (45 % of total emissions) to 4.8 m tonnes in 1996
(35 % of the total). These reductions resulted from the introduction of
catalysts on new petrol-engined cars and stricter regulations on emissions from
diesel vehicles (see Indicator 21). Industry contributed 7 % of the total
in 1996, the energy sector less than 1 %. The projected EU15 total NMVOC
emissions from transport for 2010, based on a baseline scenario, are about 67 %
below the 1990 level (EEA, 1999). Whether the current and proposed/draft targets
for the EU Member States for national emissions will be achieved by 2010 will
depend on the implementation of the policies and measures which have been adopted,
by all relevant sectors (transport, industry, energy, households), and the introduction
and implementation of additional policies and measures.
Figure 1.6: Emissions of NMVOCs per sector (EU 15)
Source: EEA-ETC/AE
Note: The sector 'other' includes mainly emissions from the use of solvents
within industry and households
NOx
Emissions of NOx from transport fell from 7.1 to 6.2 m tonnes
in the period 1990-1996, a 13 % reduction. These reductions resulted from
the introduction of catalysts on new petrol-engined cars and stricter regulations
for emissions from diesel vehicles (see Indicator 21). The contribution to total
emissions increased only very slightly (from 54 to 55 %) over the same
period. The energy sector contributed some 19 % of the total in 1996, the
industry sector 14 %.
Figure 1.7: Emissions of NOx per sector
(EU 15)
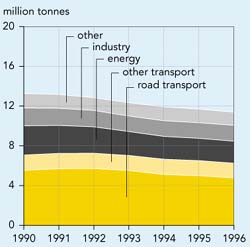
Source: EEA-ETC/AE
The first CLRTAP Nitrogen Oxide Protocol target (stabilising
to 1987 emissions by 1994) was achieved by the EU as a whole and by most Member
States. However, the fifth environmental action programme target of a 30 %
reduction by 2000 with respect to 1990 will not be achieved. The projected EU15
total NOx emissions from transport for 2010 based on a baseline scenario
are about 43 % below the 1990 level (EEA, 1999). Meeting the targets of
the European Commission. s 1999 proposal for a Directive on national emission
ceilings would require further decreases of emissions from the transport and
other sectors.
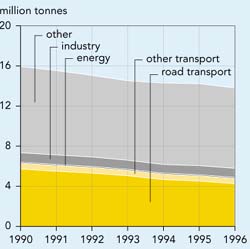
SO2
Transport contributed less than 10 % of the total SO2
emissions in 1996, the energy sector 62 % and industry 20 %. Total
emissions of SO2 in the EU fell from 16.3 to 9.4 m tonnes between
1990 and 1996 (a reduction of 42 %). International ship traffic is responsible
for most of the transport contribution to SO2 emissions, due to the
use of very high sulphur content (around 10 %) fuels. Future actions to
abate SO2 emissions from shipping our outlined in the Communication
on the Development of Short Sea Shipping in Europe (CEC, 1999c). The contribution
of marine transport to acidifying emissions is discussed further in Box 1.1.
Figure 1.8: Emissions of SO2 per sector
(EU 15)
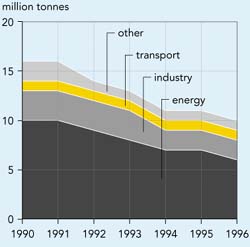
Source: EEA-ETC/AE
|
Figure 1.9: Contribution from international shipping in the North
Sea and north-east Atlantic ocean to total European acidifying emissions
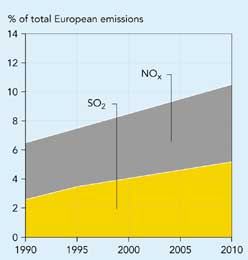
Source: EEA (1999), EMEP (1998)
Box 1.1: Emissions of acidifying substances from international ship
traffic
While the European Commission. s strategy to combat acidification (CEC,
1997a) recognised the cost-effectiveness of emission reductions from ship
traffic compared with reductions of land-based emissions, shipping accounts
for increasingly larger shares of acidifying emissions.
In absolute values (1995 data), emissions of SO2 and NOx
from international ship traffic were similar in magnitude to the contribution
of individual large countries. International ship traffic sources account
for about 10-15 % of total deposition over western Europe. If no
further reductions are accomplished, the relative contribution of emissions
from international ship traffic is expected to double by 2010.
The cost of limiting the sulphur content of marine bunkers in the North
Sea and the Baltic sea to 1.5 % (the maximum value accepted by MARPOL)
has been estimated at about EUR 87 m per year. Equivalent reductions in
total emissions from land-based sources (such as power stations) would
cost about EUR 1 150 m per year.
|
Future work
- National reporting often provides incomplete time
series for the period 1980-1990 and this data has therefore been excluded
from this analysis. Data for the period 1990 to 1996 is more complete and
presents fewer inconsistencies. The quality of the indicator would be enhanced
by improved national reporting (in particular for the period 1980-1990 and
onwards for some Member States and pollutants).
- National estimates should be better documented, so
as to identify possible inconsistencies. Consistent estimation methods should
be used by Member States for the complete time series. A simple, consistent
methodology should be developed to compare national estimates with centrally
produced estimates prepared for all Member States. The results of such comparisons
should be communicated to Member States to improve the consistency, transparency,
comparability and reliability of national estimates, and ensure that central
estimates are converging with national estimates.
|
Data
Emissions of CO2 by transport
Unit: mtoe
|
| |
1980
|
1985
|
1990
|
1991
|
1992
|
1993
|
1994
|
1995
|
1996
|
|
Austria
|
|
13
|
15
|
17
|
17
|
17
|
17
|
18
|
18
|
|
Belgium
|
|
18
|
23
|
23
|
24
|
25
|
25
|
25
|
26
|
|
Denmark
|
|
11
|
13
|
13
|
13
|
13
|
14
|
14
|
14
|
|
Finland
|
|
10
|
13
|
12
|
12
|
12
|
12
|
12
|
12
|
|
France
|
|
97
|
122
|
121
|
124
|
130
|
127
|
129
|
134
|
|
Germany
|
|
136
|
169
|
172
|
175
|
181
|
179
|
182
|
181
|
|
Greece
|
|
14
|
17
|
18
|
18
|
19
|
19
|
19
|
19
|
|
Ireland
|
|
5
|
6
|
6
|
6
|
6
|
7
|
6
|
8
|
|
Italy
|
|
81
|
97
|
100
|
104
|
106
|
106
|
109
|
110
|
|
Luxembourg
|
|
2
|
3
|
4
|
4
|
4
|
4
|
4
|
4
|
|
Netherlands
|
|
26
|
30
|
31
|
33
|
34
|
34
|
36
|
38
|
|
Portugal
|
|
8
|
11
|
12
|
13
|
13
|
14
|
14
|
15
|
|
Spain
|
|
44
|
66
|
71
|
73
|
72
|
75
|
77
|
82
|
|
Sweden
|
|
18
|
21
|
20
|
21
|
21
|
22
|
22
|
22
|
|
United Kingdom
|
|
104
|
132
|
130
|
133
|
136
|
137
|
137
|
142
|
|
EU15
|
|
585
|
738
|
749
|
771
|
788
|
793
|
803
|
825
|
| Source:
Eurostat |
|
Emissions of NOx by transport (as reported by Member
States to international conventions and the Commission).
Unit: 1 000 tonnes
|
| |
1980
|
1985
|
1990
|
1991
|
1992
|
1993
|
1994
|
1995
|
1996
|
|
Austria
|
114
|
116
|
99
|
105
|
100
|
96
|
102
|
89
|
86
|
|
Belgium
|
194
|
186
|
161
|
171
|
180
|
181
|
182
|
175
|
163
|
|
Denmark
|
147
|
147
|
125
|
121
|
119
|
117
|
103
|
100
|
98
|
|
Finland
|
139
|
139
|
160
|
139
|
153
|
149
|
146
|
139
|
172
|
|
France
|
1 167
|
1 167
|
1 128
|
1 137
|
1 143
|
1 112
|
1 086
|
1 035
|
977
|
|
Germany
|
1 457
|
1 516
|
1 423
|
1 367
|
1 323
|
1 281
|
1 200
|
1 186
|
1 061
|
|
Greece
|
137
|
139
|
140
|
145
|
145
|
141
|
144
|
143
|
145
|
|
Ireland
|
49
|
49
|
45
|
49
|
50
|
45
|
48
|
49
|
67
|
|
Italy
|
831
|
869
|
968
|
1 160
|
1 228
|
1 191
|
974
|
995
|
995
|
|
Luxembourg
|
12
|
10
|
11
|
12
|
12
|
12
|
10
|
10
|
10
|
|
Netherlands
|
349
|
337
|
337
|
336
|
326
|
312
|
304
|
315
|
302
|
|
Portugal
|
110
|
110
|
197
|
207
|
220
|
220
|
226
|
238
|
238
|
|
Spain
|
725
|
665
|
566
|
583
|
603
|
586
|
593
|
598
|
603
|
|
Sweden
|
173
|
173
|
261
|
261
|
261
|
253
|
260
|
241
|
172
|
|
United Kingdom
|
1 155
|
1 214
|
1 459
|
1 451
|
1 398
|
1 341
|
1 282
|
1 203
|
1 166
|
|
EU15
|
6 760
|
6 837
|
7 080
|
7 246
|
7 260
|
7 038
|
6 660
|
6 517
|
6 255
|
| Source: EEA-ETC/AE |
|
Emissions of NMVOCs by transport (as reported by Member States
to international conventions and the Commission).
Unit: 1 000 tonnes
|
| |
1980
|
1985
|
1990
|
1991
|
1992
|
1993
|
1994
|
1995 |
1996
|
|
Austria
|
133
|
125
|
96
|
97
|
85
|
75
|
68
|
61
|
53
|
|
Belgium
|
189
|
185
|
107 |
113
|
118
|
117
|
114
|
107
|
98
|
|
Denmark
|
97
|
97
|
101
|
97
|
93 |
85
|
77
|
71 |
67
|
|
Finland
|
74
|
74
|
91
|
74
|
57
|
56
|
53
|
81
|
87
|
|
France
|
1 372
|
1 372
|
1 248
|
1 232
|
1 214
|
1 159
|
1 086
|
1 007
|
922
|
|
Germany
|
1 398
|
1 417
|
1 490
|
1 174
|
1 007
|
859
|
714
|
634
|
568
|
|
Greece
|
62
|
115
|
150
|
155
|
161
|
173
|
178
|
182
|
191
|
|
Ireland
|
63
|
63
|
63
|
64
|
65
|
57
|
59
|
59
|
62
|
|
Italy
|
1 189
|
1 013
|
1 049
|
1 195
|
1 245
|
1 253
|
1 184
|
1 218
|
1 218
|
|
Luxembourg
|
9
|
9
|
11
|
8
|
8
|
8
|
9
|
9
|
9
|
|
Netherlands
|
238
|
226
|
200
|
180
|
172
|
162
|
156
|
154
|
145
|
|
Portugal
|
80
|
80
|
67
|
72
|
80
|
84
|
87
|
140
|
140
|
|
Spain
|
488
|
488
|
328
|
345
|
358
|
364
|
343
|
324
|
303
|
|
Sweden
|
179
|
179
|
216
|
216
|
199
|
191
|
188
|
179
|
160
|
|
United Kingdom
|
875
|
926
|
1 069
|
1 057
|
1 012
|
948
|
890
|
822
|
762
|
|
EU15
|
6 448
|
6 370
|
6 287
|
6 081
|
5 874
|
5 591
|
5 207
|
5 047
|
4 785
|
| Source: EEA-ETC/AE |

Document Actions
Share with others