Indicator 1: Energy consumption
| Transport is one of the main energy-consuming
sectors in the EU (over 30 % of total final energy consumption in 1997).
Its energy use is growing at about 3 % per annum. Road transport is
responsible for 73 % of transport energy consumption.
Figure 1.2: Final energy consumption by transport mode
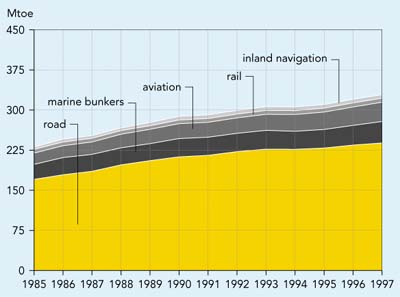
Source: Eurostat
Note: Oil and gas pipelines account for only about
0.3 % of total energy use by transport and are not included in the
chart.
Objective
- Reduce consumption of fossil energy by transport.
Definition
- Final energy consumption by transport mode
(road, aviation, marine, rail and inland waterways), expressed in million
tonnes of crude oil equivalent (mtoe).
Note: marine bunkers (the amount of energy
carried in marine bunkers) does not necessarily reflect the marine activity
of the country in which the bunkers are located. The same may be true,
to a lesser extent, for aviation. Data for inland waterways may include
some coastal shipping.
|
Policy and targets
Transport is nearly fully dependent on fossil fuels
(99 %), and contributes significantly to emissions of greenhouse gases,
acidifying substances, ozone precursors and other air pollutants. The Common
Transport Policy. s action programme highlights the need to . reduce the dependence
of economic growth on increases in transport activity and any such increases
on energy consumption. and calls for the development of . less environmentally
damaging energy alternatives. . An important policy development is the voluntary
agreement with the car industry (CEC, 1998b), which aims to reduce CO2
emissions from new passenger cars (and therefore reduce energy consumption).
Further measures, targets and goals aimed at reducing
energy consumption exist at the national level, for instance:
- the German automobile industry is committed to a
25 % reduction in fuel consumption of new cars built and sold in Germany
between 1990 and 2005;
- the Italian Government has developed a voluntary
programme, jointly with the major Italian manufacturer FIAT, to make more
efficient vehicles available.
In addition to technological improvements, some Member
States are implementing other measures to improve the sector. s energy efficiency,
such as promoting public transport, rail and inland waterways, financial support
for the purchase of fuel-efficient vehicles, traffic control and rationalisation
of urban transport.
Findings
Energy consumption by the transport sector reached 329
mtoe in 1997, or some 34 % of total final energy use.
Transport is the fastest-growing energy consumer in
the EU: its consumption grew by more than 42 % (3 % annually) during
1985-1997, while consumption by the remaining economic sectors rose only 11 %.
Per-capita energy consumption by transport in the EU (1995) was slightly below
the OECD average.
Growth in road transport is the main cause of the increase
in energy use: the increasing use of heavier more powerful cars and trucks along
with low occupancy rates and load factors have offset improvements in fuel economy
. mostly related to engine technology (see Indicator 20). Aviation and marine
bunkers are also contributing to the sector. s growing energy use.
In the period 1985-1997 energy consumption by:
- road transport increased by more than 120 %
in Luxembourg and Portugal, as a result of rising car ownership levels and
lower road fuel prices in Luxembourg compared with neighbouring Member States.
Only Sweden experienced growth rates less than 20 %;
- marine bunkering increased in Ireland (400 %)
and Denmark (260 %), continued to rise in Greece, Sweden, Belgium and
Spain (more than 100 %), and declined only in Germany, Ireland and Finland.
In absolute levels, consumption by marine bunkers is high in Belgium, Greece,
Spain and especially the Netherlands;
- air transport increased by nearly 240 % in Luxembourg,
and by between 110 and 142 % in the Netherlands, Belgium, Austria and
Ireland; only Portugal showed values below 30 %. In absolute levels,
energy consumption by aviation is higher in Germany, France and the United
Kingdom;
- rail increased markedly in Ireland (99 %) and
in Spain, the Netherlands and Italy (between 63 and 41 %), and declined
in Belgium, Germany, Sweden, Luxembourg and Finland (where energy consumption
decreased by about 20 %);
- inland navigation increased steadily in France (by
more than 160 %) and, to a lesser extent, in Spain, Belgium and Greece
(between 50 and 100 %), and decreased only in Portugal, Finland, and
notably in Germany and Sweden.
In 1997, road transport was responsible for 73 %
of the energy use of the EU transport sector, marine bunkers for 12 %,
aviation for 11 % and inland navigation and rail transport for 2 %
each. Differences between countries are illustrated in Figure 1.3.
No breakdown of energy data for passenger and freight
transport is available at Eurostat, but IEA data shows that passenger transport
accounts for 55 to 65 % of total energy use by transport. Energy use by
freight is growing at the fastest rate.
Figure 1.3: Final energy consumption by transport: modal
shares
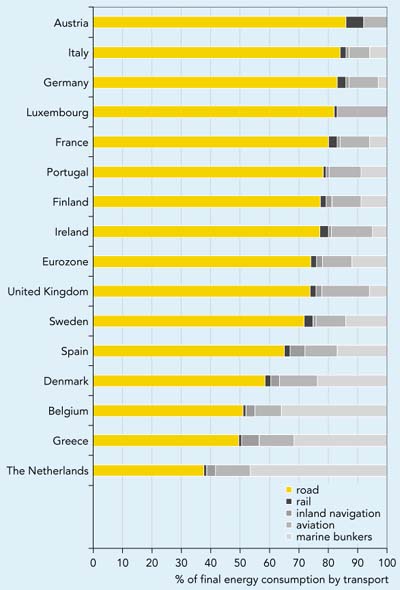
Source:
Eurostat
Future work
- Energy use by transport comprises not only direct
consumption (vehicle operation) but also indirect consumption from primary
fuel production (extraction) and transformation (refineries, power generation,
etc.), infrastructure and vehicle manufacture, maintenance and disposal, etc.
Primary energy consumption would therefore provide a better basis for comparing
transport modes. However, such statistics are currently only available in
a few countries and are not always comparable. Efforts are needed to improve
methodologies and data to develop an EU appraisal of energy consumption by
transport from a life-cycle perspective.
- No split of energy consumption according to freight
and passenger transport is currently available at Eurostat. Such information
would enable a better assessment of energy consumption by freight and passenger
transport.
|
Data
Final energy consumption by transport
Unit: Mtoe
|
| |
1985
|
1990
|
1991
|
1992
|
1993
|
1994
|
1995
|
1996
|
1997
|
|
Austria
|
4.5
|
5.4
|
6.0
|
6.0
|
6.1
|
6.1
|
6.2
|
6.3
|
6.3
|
|
Belgium
|
8.4
|
11.8
|
12.0
|
12.4
|
12.6
|
12.6
|
12.4
|
13.4
|
14.3
|
|
Denmark
|
4.0
|
5.5
|
5.3
|
5.4
|
5.7
|
6.0
|
6.2
|
6.2
|
6.2
|
|
Finland
|
3.8
|
4.8
|
4.7
|
4.8
|
4.6
|
4.6
|
4.4
|
4.4
|
4.6
|
|
France
|
35.9
|
44.5
|
44.2
|
45.1
|
46.9
|
45.6
|
46.5
|
48.5
|
49.8
|
|
Germany
|
51.6
|
61.3
|
61.3
|
63.0
|
65.0
|
63.9
|
64.9
|
64.6
|
65.8
|
|
Greece
|
5.8
|
8.3
|
8.3
|
8.8
|
9.6
|
9.7
|
10.0
|
9.7
|
9.8
|
|
Ireland
|
1.7
|
2.0
|
2.1
|
2.1
|
2.1
|
2.3
|
2.3
|
2.9
|
3.1
|
|
Italy
|
31.2
|
36.1
|
36.9
|
38.3
|
39.1
|
39.1
|
40.1
|
40.3
|
41.1
|
|
Luxembourg
|
0.6
|
1.0
|
1.2
|
1.3
|
1.3
|
1.3
|
1.3
|
1.4
|
1.5
|
|
Netherlands
|
17.5
|
21.1
|
21.6
|
22.3
|
23.1
|
22.8
|
23.6
|
24.5
|
25.6
|
|
Portugal
|
3.1
|
4.3
|
4.6
|
4.9
|
5.0
|
5.2
|
5.3
|
5.6
|
5.7
|
|
Spain
|
17.7
|
26.1
|
28.0
|
28.7
|
27.9
|
28.7
|
29.2
|
32.3
|
33.7
|
|
Sweden
|
7.0
|
7.9
|
7.9
|
8.3
|
8.2
|
8.6
|
8.7
|
8.7
|
9.0
|
|
United Kingdom
|
38.0
|
48.0
|
47.2
|
48.2
|
49.3
|
49.3
|
49.4
|
51.4
|
52.4
|
|
EU15
|
230.9
|
288.1
|
291.1
|
299.6
|
306.4
|
306.0
|
310.5
|
320.3
|
328.9
|
|
Note: Consumption of marine bunkers, and consumption of oil and gas pipelines
(declared only by Belgium, France, Italy and the United Kingdom) is included.
Source: Eurostat
|

Document Actions
Share with others