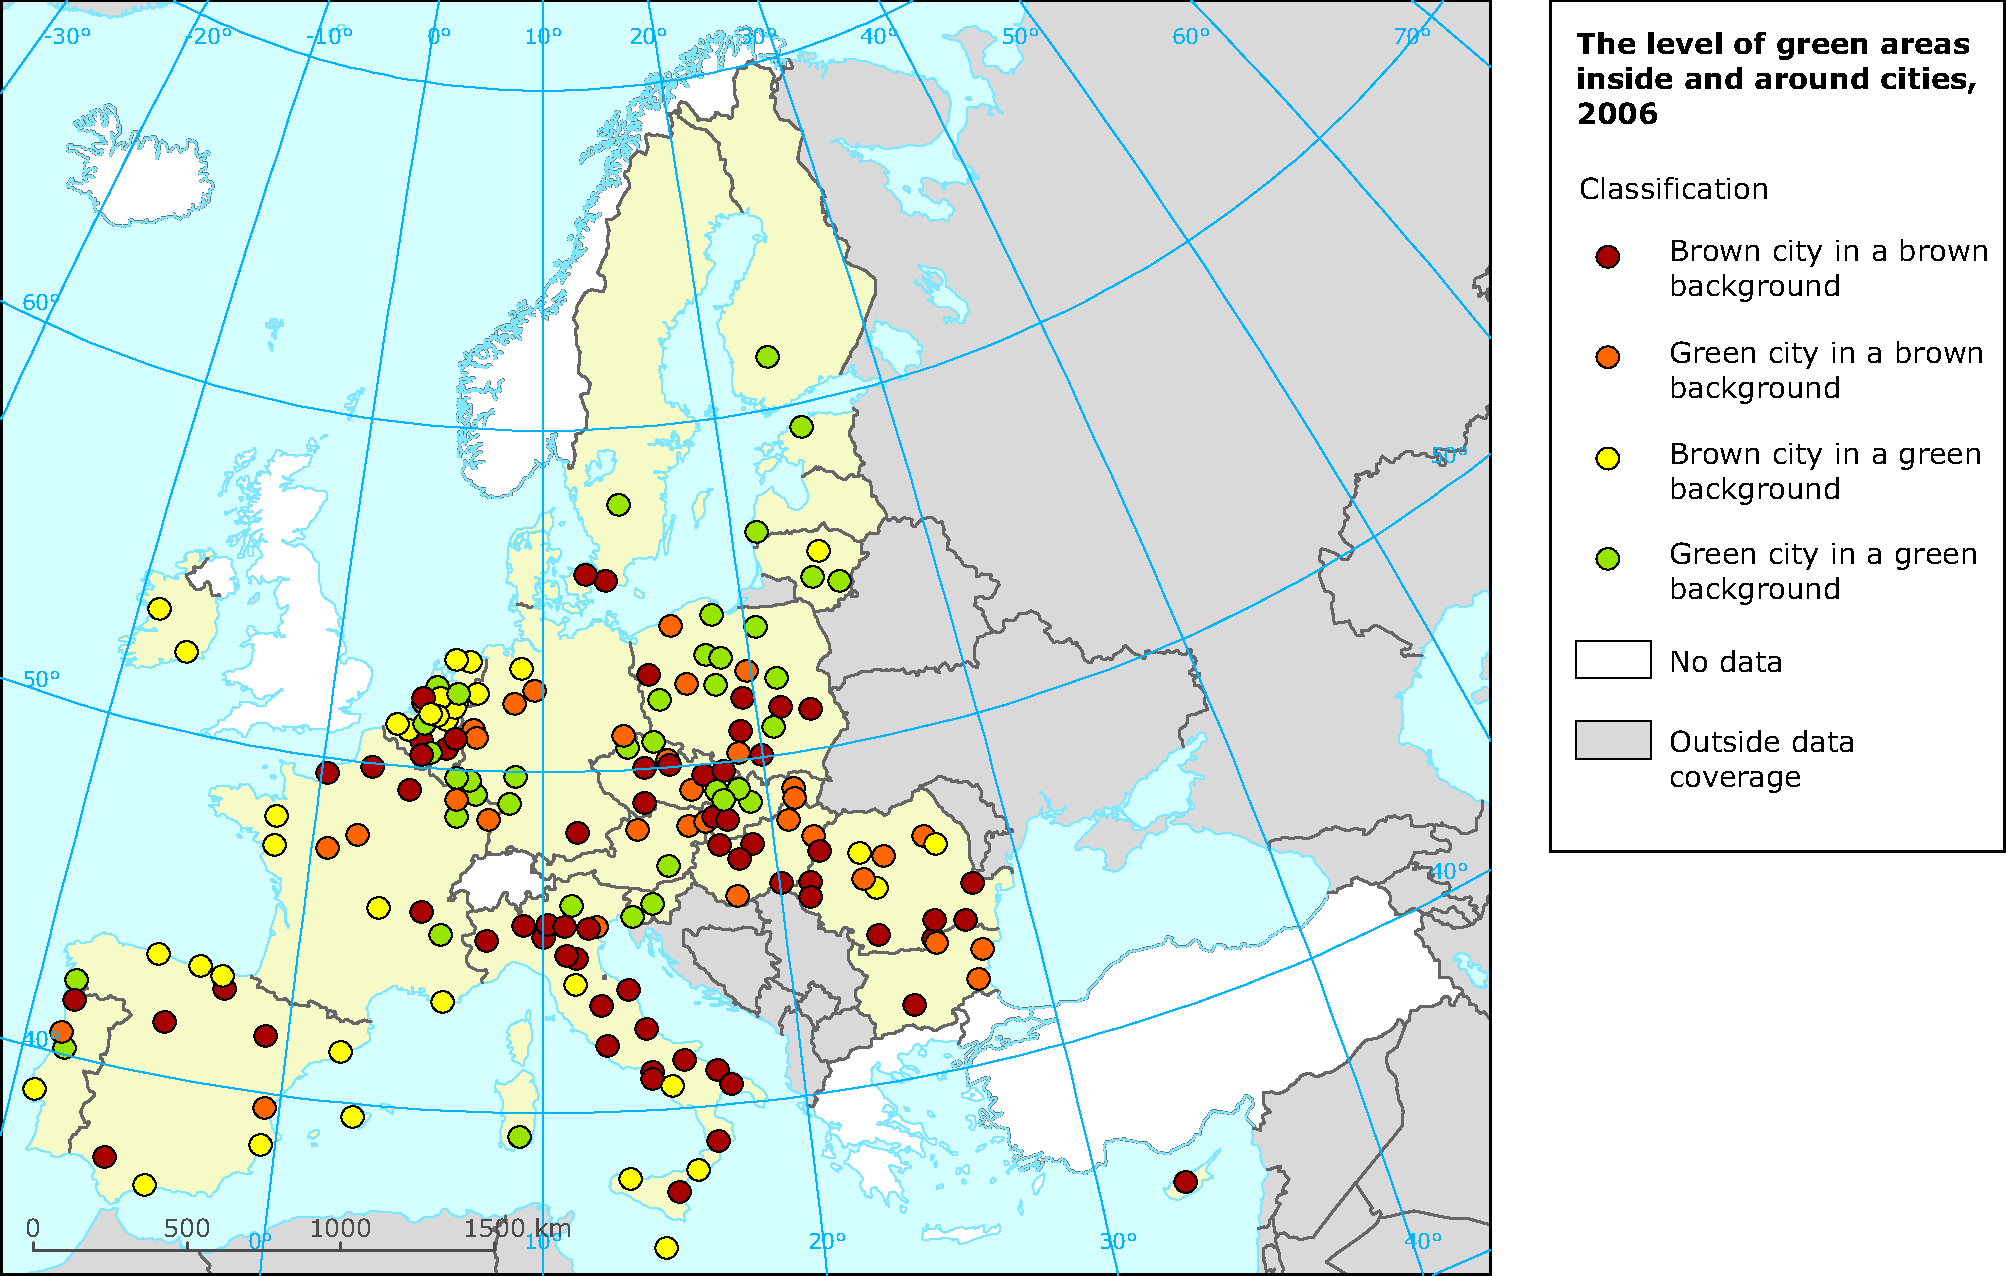
Then we calculated the difference between total mean and the city value. Using these two values (difference to mean city/ difference to mean UMZ*) we classified all cities into the following classes:
1 - Brown city in a brown background
2 - Green city in a brown background
3 - Brown city in a green background
4 - Green city in a green background
The above classification uses the following classification approach:
Class 1 - Brown city in a brown background
(UMZ and City values < total mean)
Class 2 - Brown city in a green background
(UMZ values >= total man AND city values < total mean)
Class 3 - Green city in a brown background
(UMZ values < total mean AND city values >= total mean)
Class 4 - Green city in a green background
(UMZ AND city values >= total mean)


Document Actions
Share with others