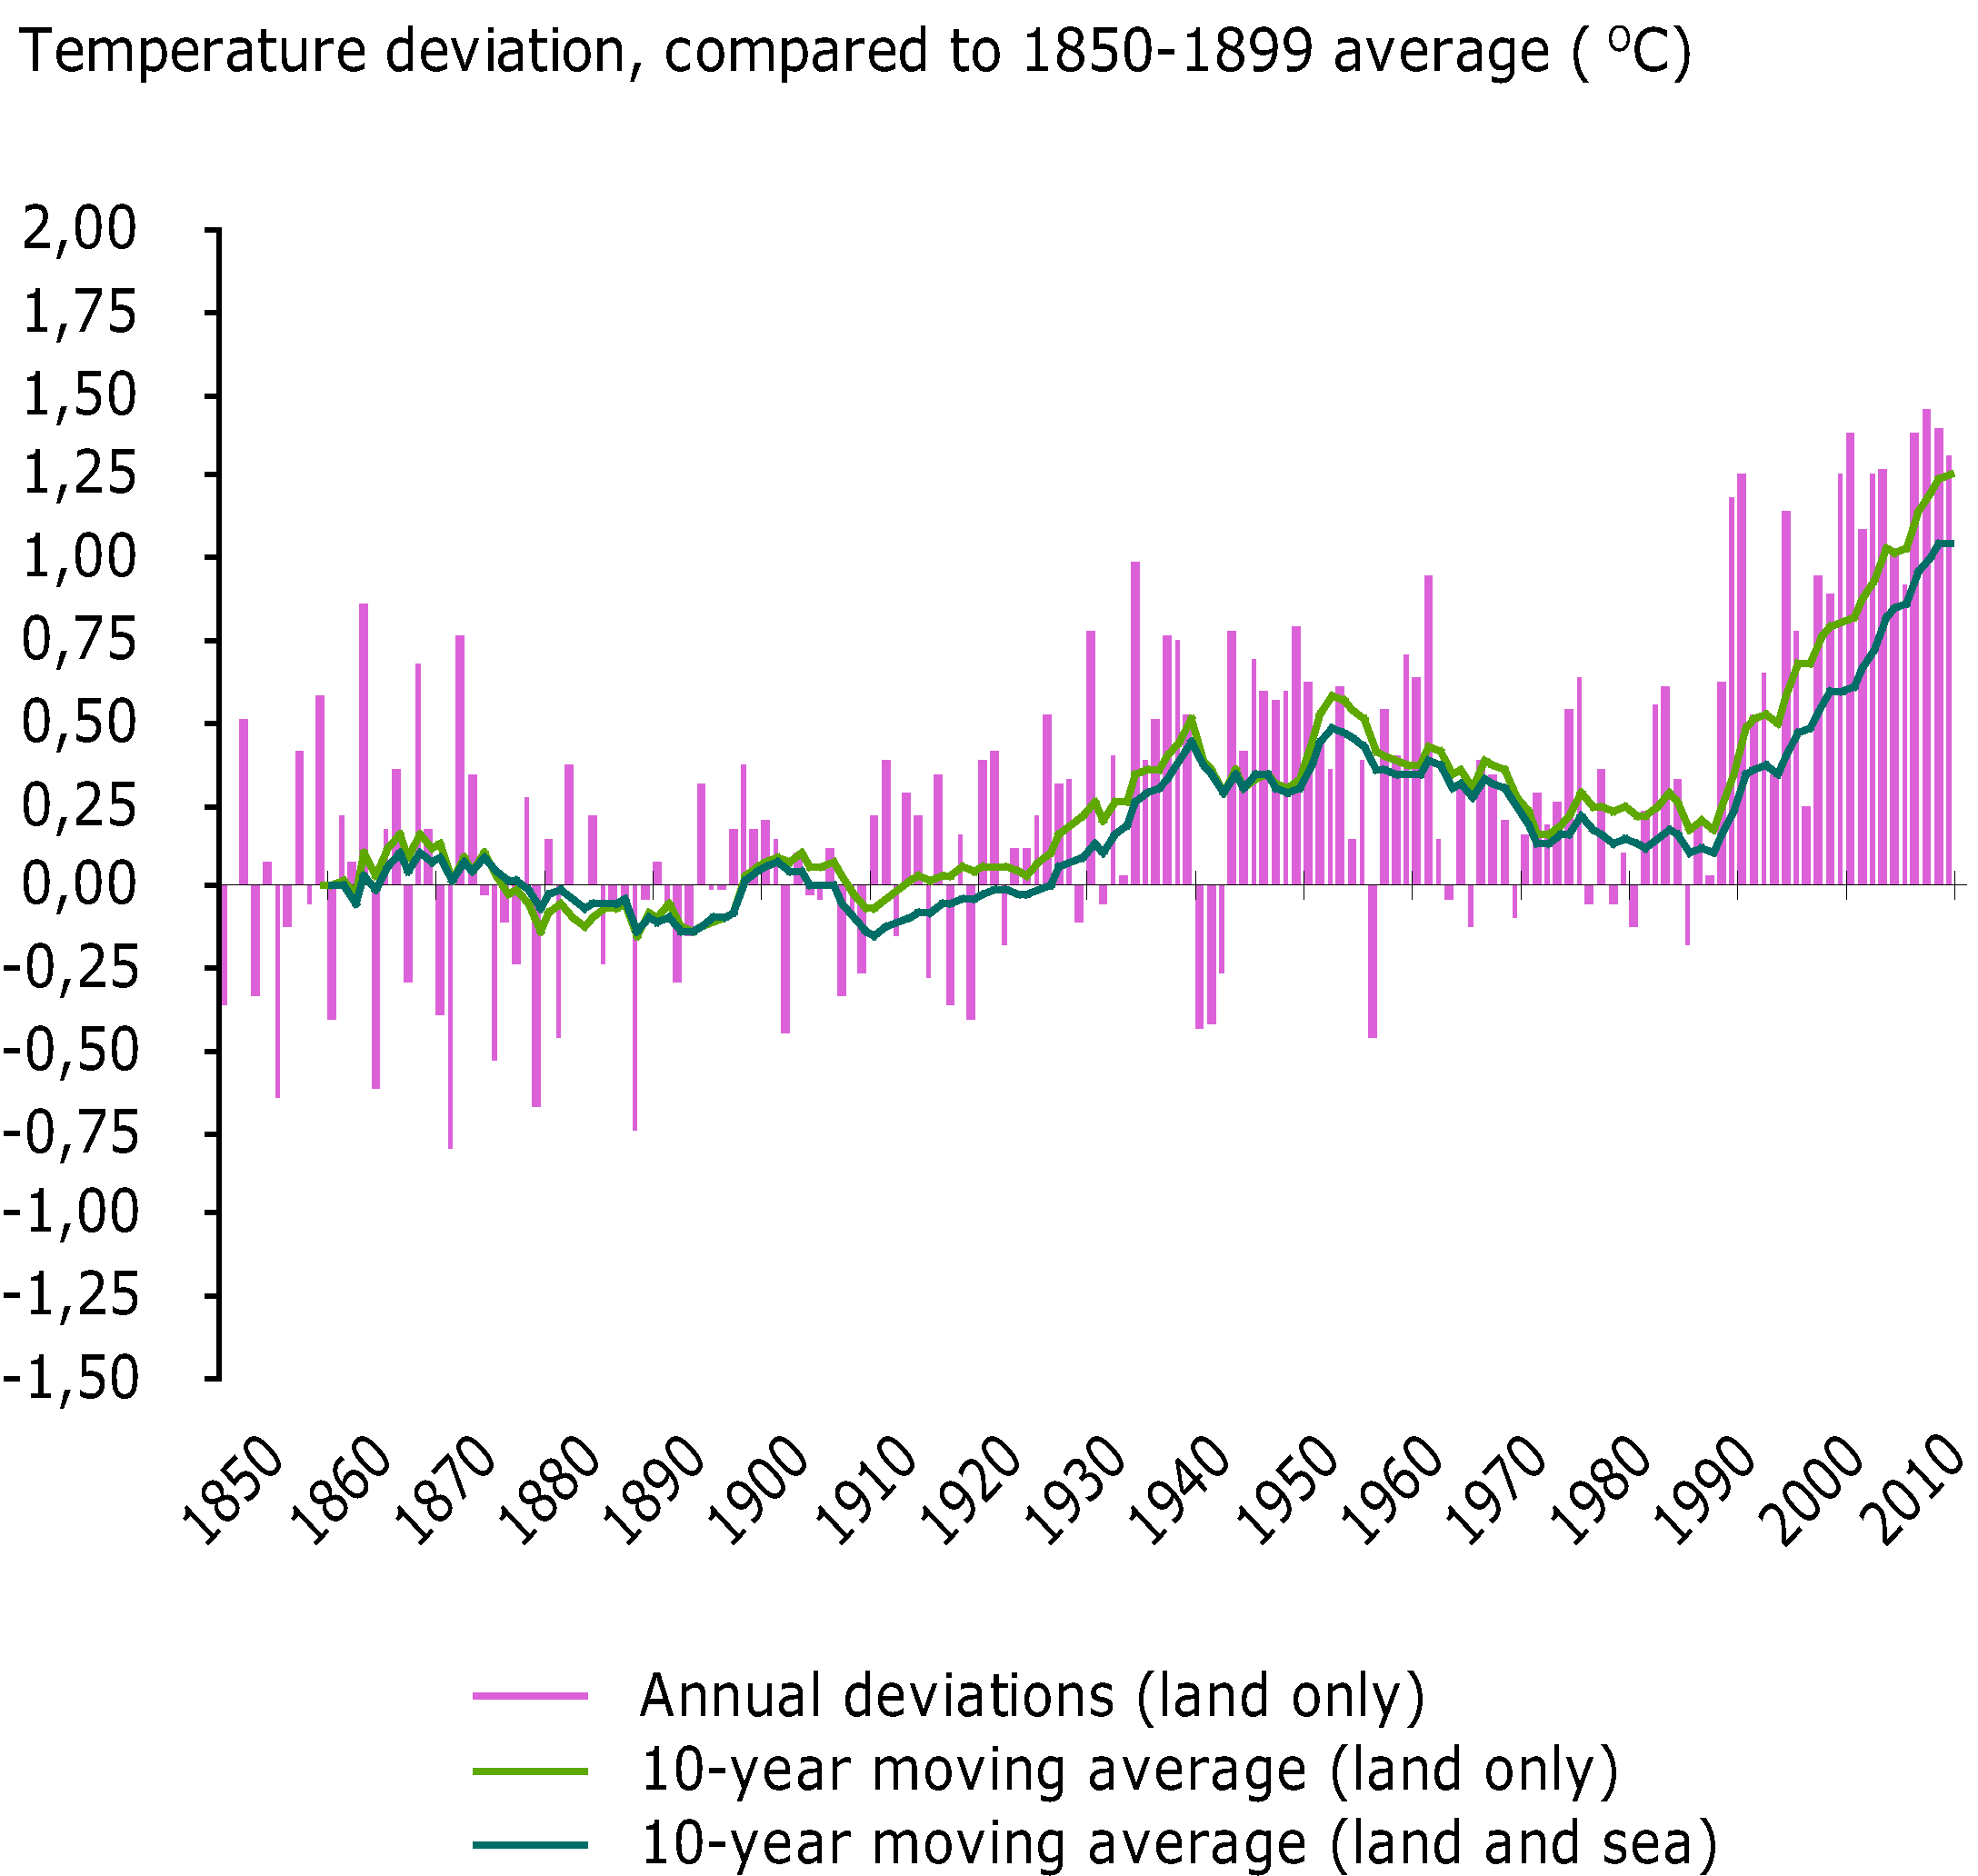
The European mean annual temperature deviations are in the source in relation to the base period 1961-1990. The annual deviations shown in the chart have been adjusted to be relative to the period 1850-1899 to better monitor the EU objective not to exceed 2ºC above pre-industrial values. Over Europe average annual temperatures during the real pre-industrial period (1750-1799) were very similar to those during 1850-99. Europe is defined as the area between 35º to 70º Northern latitude, -25º to 30º Eastern longitude, plus Turkey (=35º to 40º North, 30º to 45º East). The resulting temperature anomalies were obtained using KNMI climate explorer.
Geographical coverage note: Europe


Document Actions
Share with others