This briefing is based on data and information available from the European Commission (verified emissions, free allocation and further information on operators under the EU Emissions Trading System (ETS) for the years up until 2020) and the EEA (latest projections of national ETS emissions until 2040, as reported by EU Member States, Iceland and Norway in 2021). A detailed analysis is available in the report Trends and projections in the EU ETS in 2021, prepared for the EEA by the European Topic Centre on Climate Change Mitigation and Energy (ETC/CME, forthcoming).
Historical decrease in emissions associated with the pandemic and changes in the electricity mix
The EU ETS covers about 36% of the EU’s total greenhouse gas emissions. It sets a cap on emissions from emission-intensive activities (i.e. electricity and heat production, cement manufacture, iron and steel production, oil refining and other industrial activities) and aviation within the European Economic Area. Within this emissions budget, companies can reduce their emissions and trade allowances to achieve reductions in greenhouse gas emissions at the least cost.
Greenhouse gas emissions from stationary installations in the EU ETS decreased from 1,530 million tonnes of carbon dioxide equivalent (MtCO2e) in 2019 to 1,355MtCO2e in 2020, a reduction of 11.4%. This represents the largest drop in emissions since the ETS began operating in 2005. It is comparable only to the decrease observed in 2009 at the height of the financial crisis.
This decrease in emissions adds to the remarkable reductions that occurred between 2018 and 2019. In that year ETS emissions decreased by 9%, driven by the substitution of coal with lower carbon fuels, linked to low gas prices and the increased penetration of renewable sources of energy.
Compared with 2005, stationary ETS emissions decreased by 43% in 2020 (Figure 1).

More information
Combustion installations (mainly power stations) are responsible for 60% of EU ETS emissions [1]. This source is the main driver of the decrease in emissions observed since the start of the system. Between 2019 and 2020 alone, emissions from combustion installations decreased by 13.9 %, while emissions have decreased by 38% since the start of the third trading period in 2013.
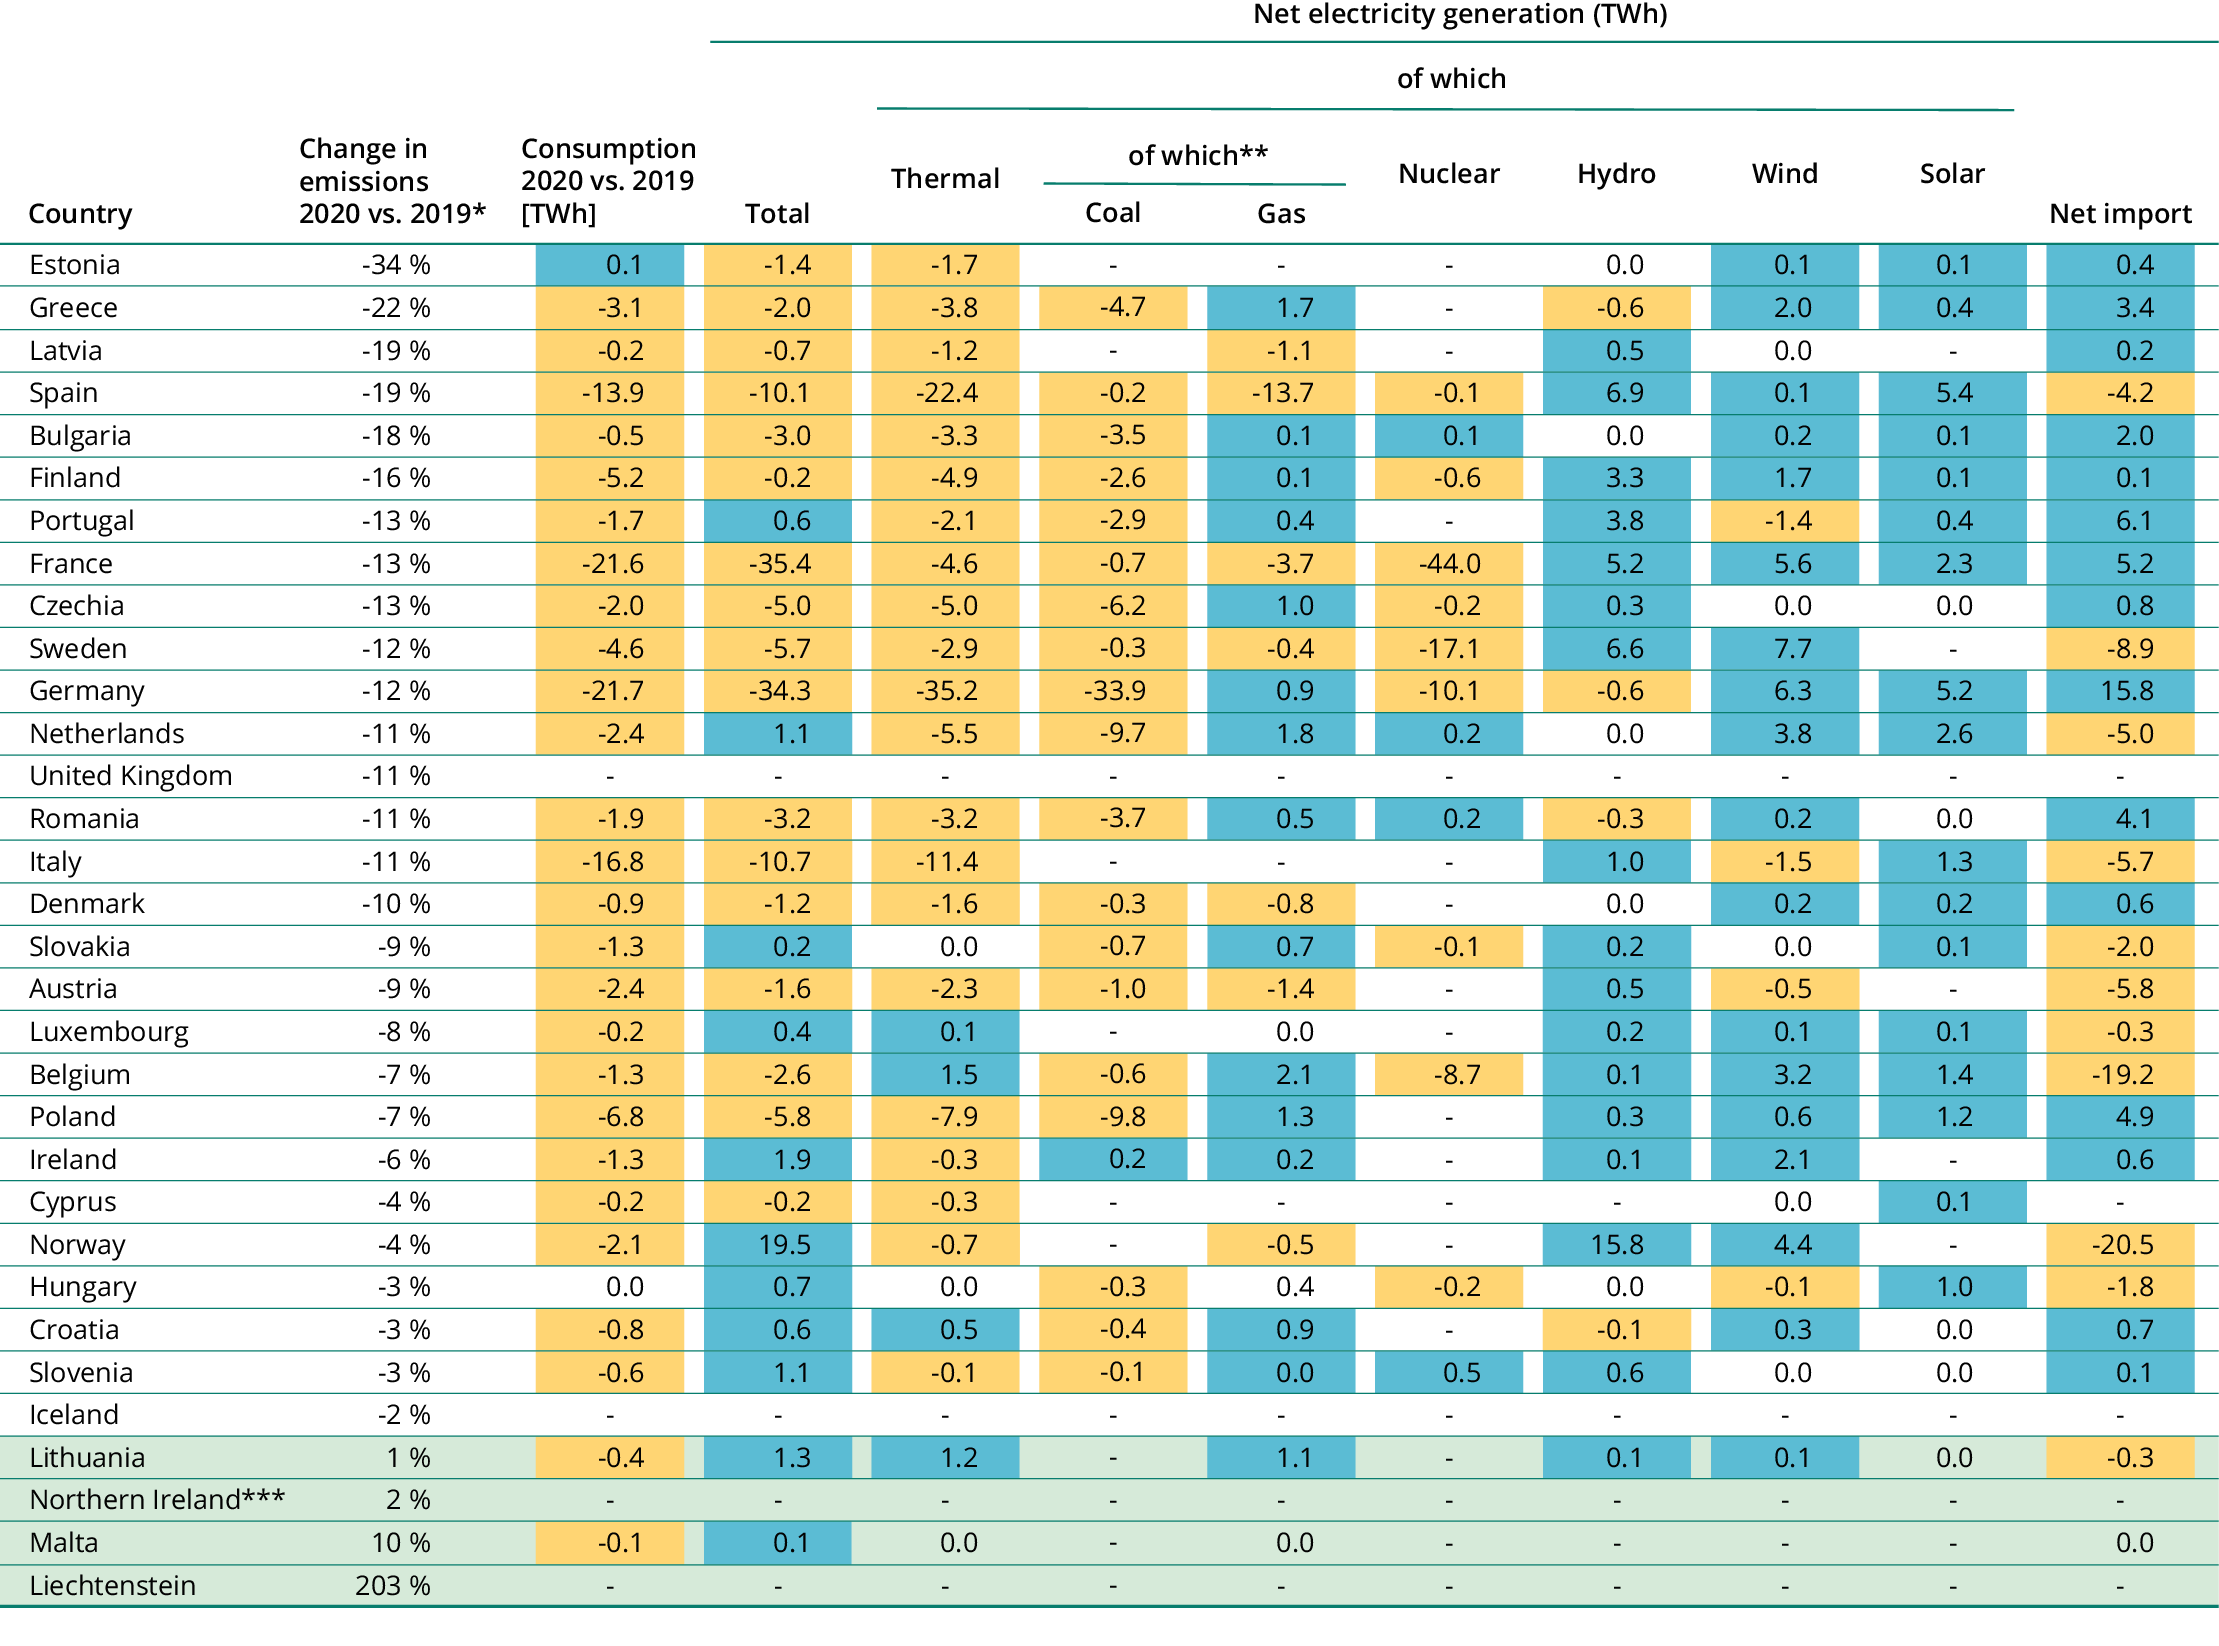
The economic downturn due to the COVID-19 pandemic and its associated restrictions reduced electricity consumption in the EU by 115GWh or 4.2% (Eurostat, 2021). In addition, the EU electricity mix continued on a path towards decarbonisation, following the trend observed over the last few years. Coal-fired power generation keeps declining in Europe, linked to the carbon price signal and national coal exit strategies. By contrast, and despite the overall reduction in electricity generation, generation from renewables continued to increase, benefiting from lower running costs and supportive policies (Table 1). As a result, the share of renewables in the EU electricity mix increased by 3.2 percentage points between 2019 and 2020, according to early estimates by the EEA (EEA, 2021b). In contrast to the previous year, no further fuel switch to natural gas was observed as a result of the general decrease in fossil fuel consumption for power generation.
The largest absolute decrease in coal-fired power was observed in Germany, followed by Poland and the Netherlands. The only Member State that increased electricity generation from coal was Ireland, linked to small fluctuations in the activity of its only coal-fired power plant.
Notes:
*Combustion installations (activity code 20).
**Additional thermal electricity generation is reported by Eurostat from oil and renewable and non-renewables sources, which are not shown here.
***No data for Iceland (IS), Liechtenstein (LI), Great Britain (GB) and Northern Ireland (XI) available.
Sources: EEA (2021a); Eurostat (2021).
More information
Emissions from ETS installations in other industrial activities [2] also fell significantly between 2019 and 2020 (-7.3%), affecting all the sectors covered by the ETS. However, the changes in emissions vary considerably from one activity to another, mainly reflecting different developments in production output, energy efficiency and the use of biomass and waste as an energy source. Iron and steel and refineries saw the largest reductions in emissions (-11.5% and -8%, respectively), while the chemical sector experienced the smallest reduction (-1.9%).
Air passenger traffic was heavily disrupted by the pandemic, resulting in a massive reduction in aviation emissions covered by the ETS, from 68MtCO2e to 25MtCO2e. This drop of 63.5% breaks the increasing trend in the sector since its inclusion in the carbon market. The eight largest aircraft operators were responsible for 51% of total emissions. The only major aircraft operator that saw an increase in emissions was Deutsche Post DHL subsidiary European Air Transport Leipzig, which, as a cargo operator, was not affected by the decline in passenger transport.
National projections indicate insufficient reductions to meet the proposed new targets
Current ETS projections do not show the reductions in emissions needed to bring the ETS into line with the new 2030 target and to set EU emissions on a path to achieve climate neutrality in 2050. In 2021, EU Member States reported their own greenhouse gas emission projections in accordance with EU legislation. According to their projections, ETS emissions are expected to decrease by between 41% and 48% by 2030, and by between 55% and 62% by 2040, relative to 2005. This will depend on the implementation of additional measures reported by some Member States. The current EU ETS target of reducing emissions by 43% by 2030 would therefore be within reach.
However, in July 2021, the European Commission unveiled a comprehensive policy package aimed at achieving at least a 55% reduction in net greenhouse gas emissions for 2030, compared with 1990. This paves the way for achieving carbon neutrality by 2050. A key part of this package was a proposal for the revision of the EU ETS. This proposal represents a major update of the EU ETS, namely a new overall ETS target of a 61% reduction by 2030, compared with 2005, including ETS aviation and the newly integrated ETS shipping. This is accompanied by a revised target of a reduction of 40%, relative to 2005, under the Effort Sharing Regulation.
It is proposed that the increased ambition of the EU ETS will be achieved by:
- a one-off reduction in the cap
- a steeper linear reduction factor
- updated parameters for the Market Stability Reserve (MSR).
A separate emissions trading system for fuels used in buildings and road transport was also proposed, as was as a carbon border adjustment mechanism. Other proposed key introductions are new regulations around the the use of the revenue use that aim to stimulate innovation and address distributional effects.
In the short term, Member States must take action to avoid a rebound in emissions linked to the pandemic. These should be backed with medium- and long-term measures to achieve the new and more ambitious target for 2030. According to recent greenhouse gas projections submitted to the EEA, the majority of Member States anticipate a decrease in their ETS emissions between 2020 and 2030 (Figure 2). This is mainly due to growth in the use of renewable energy and the phasing out of carbon-intensive power generation capacity.
However, six countries (Belgium, Estonia, Iceland, Ireland, Malta and Poland) project that their ETS emissions will increase. This is the result of the planned phasing out of nuclear production capacity, being replaced by fossil fuel capacity, or an increase in carbon-intensive energy production or other processes.
Another reason for the potential increase in ETS emissions is an anticipated higher demand for electricity due to electrification in the transport and buildings sectors. If this additional demand, which reduces emissions in accordance to the Effort Sharing Regulation, is not backed by similar growth in renewable electricity production, it might lead to an increase in ETS emissions. The picture provided by these national projections is not static and may evolve rapidly as Member States reflect recent policy developments and increase their ambition.

Note: Value for 2005 is historical; 2020 (historical) reflects verified ETS emissions as of 2020. 2020 (projected) and 2030 values are taken from EU Member States’ projections.
Source: EEA (2021a); projections of EU Member States, Iceland and Norway, compiled by ETC/CME
More information
Supply of allowances higher than demand
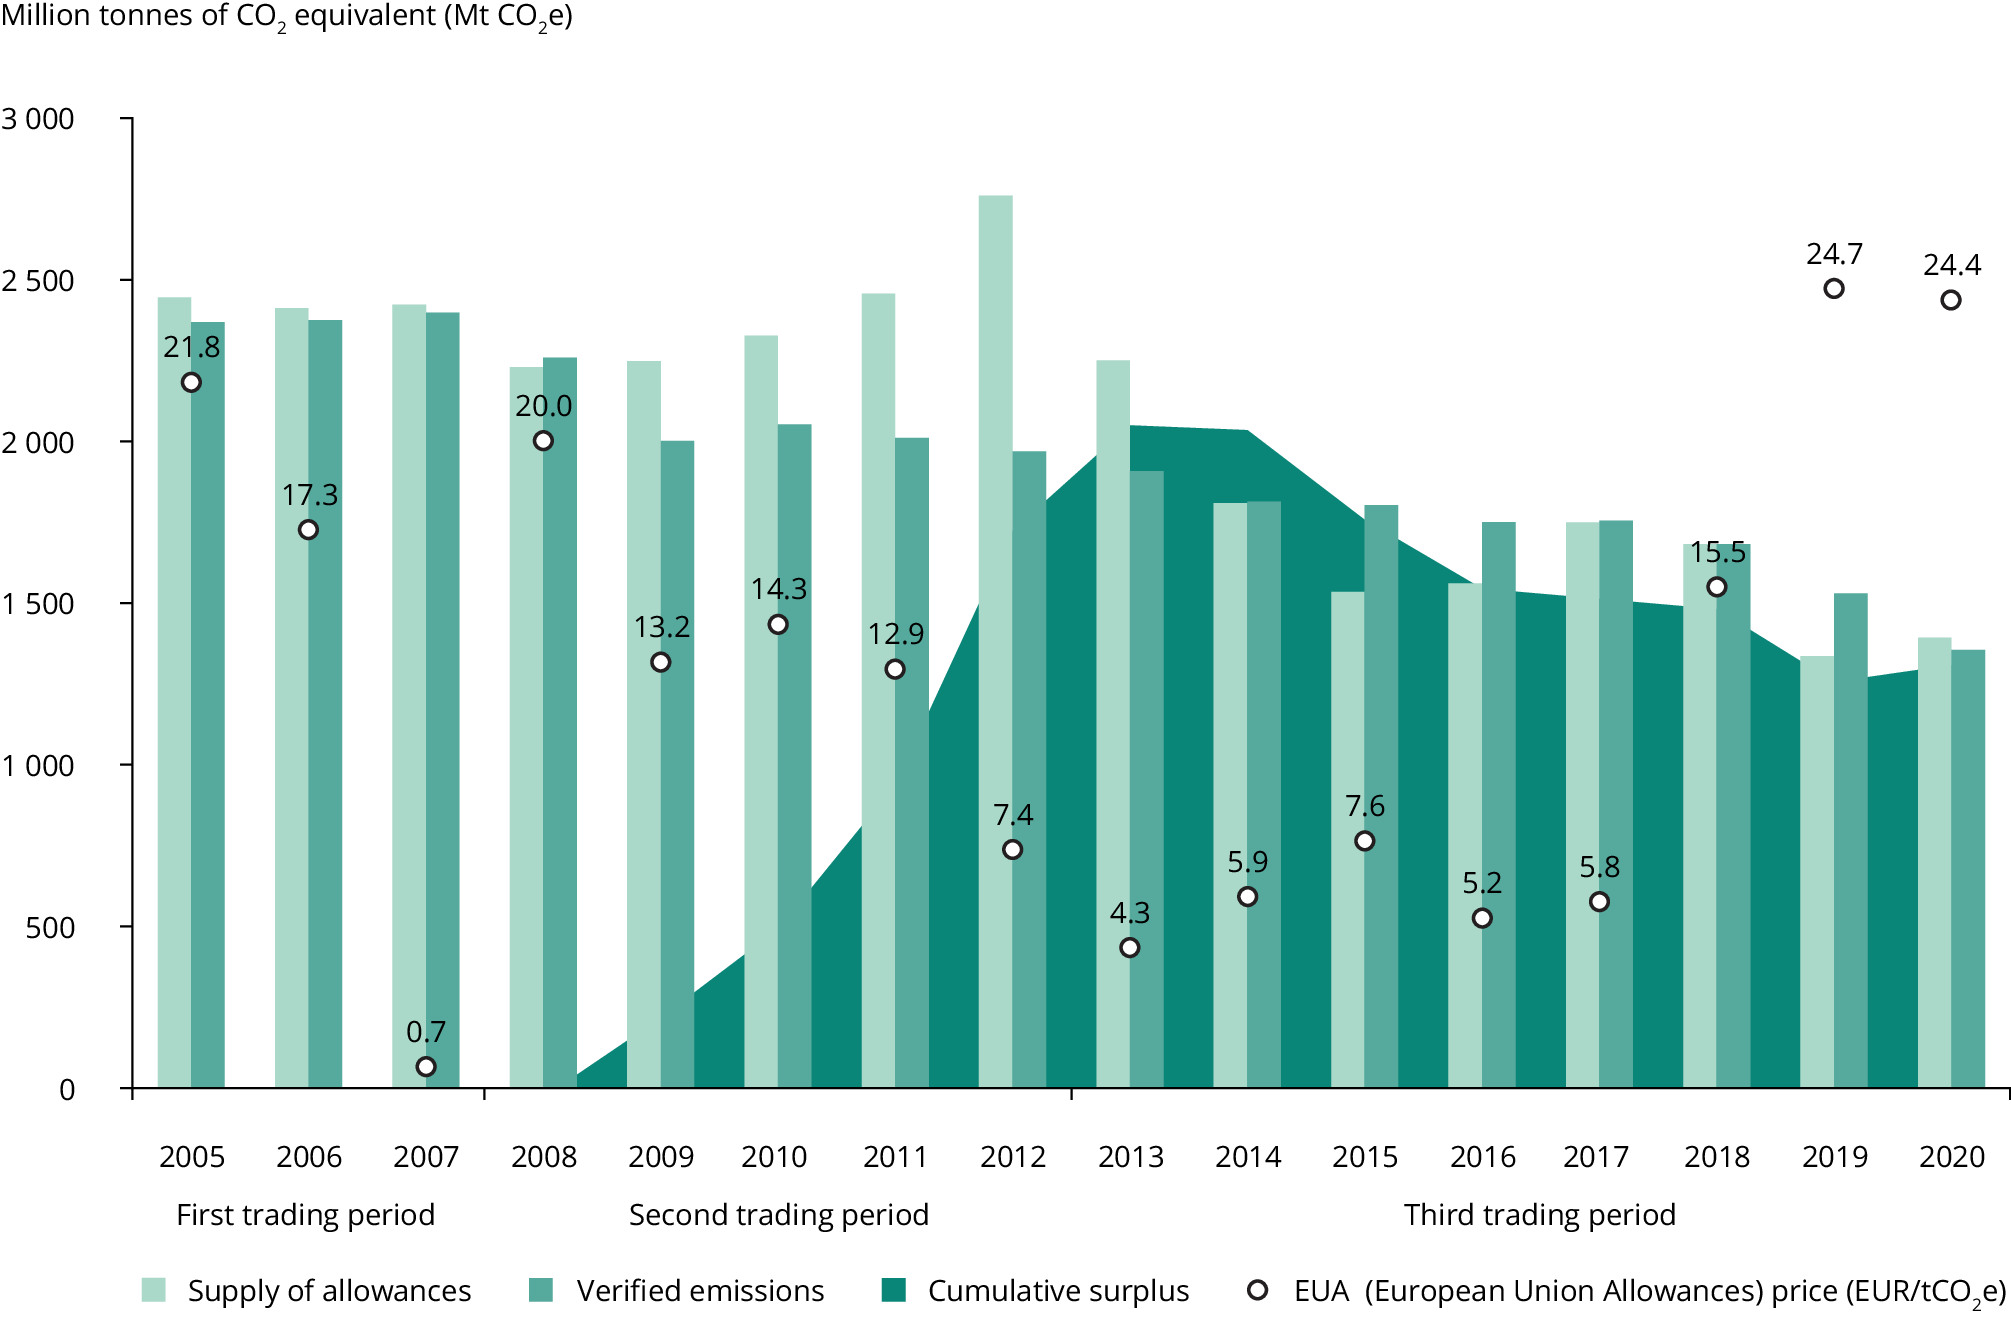
For the first time since 2013, the total supply of EU allowances (EUAs) for stationary installations was higher than the demand (Figure 3). Two factors played a role in this:
- Reduced electricity demand and industrial activity lowered the demand for emission allowances.
- There was an increase of 1.4 billion (6%) in the supply of allowances in 2020 relative to 2019.
The 1.4 billion increase includes free allocation, auctioned allowances and the exchange of international credits. The supply of allowances allocated for free was 4.3% lower than in 2019, as the free allocation to existing installations is being reduced every year. By contrast, the number of allowances auctioned in 2020 was noticeably higher than during the previous year. The main reason for this increase is the additional volumes auctioned by the United Kingdom, compensating for those withheld in 2019 because of the Brexit negotiations.
In the case of aviation, the difference between supply and demand was even more stark. In previous years, the total supply of EU aviation allowances (EUAAs), including both freely allocated and auctioned amounts, was only covering around half of the demand. This forced operators to purchase the rest in the carbon market. In 2020, as demand crashed, freely allocated allowances were enough to cover the entire demand for aviation.
The initial difference between demand and supply caused the price of allowances to drop significantly during the first months of the pandemic, reaching a low of EUR14.6 in March. However, it quickly recovered in the following months, ending the year above EUR30 per tonne (EEX, 2021).
Note: The cumulative surplus represents the difference between allowances allocated for free, auctioned or sold plus international credits surrendered or exchanged from 2008 to date minus the cumulative emissions. It also accounts for net demand from aviation during the same period.
Sources: EEA (2021a); EEX (2021); ICE (2021).
More information
Notes
[1] ‘Combustion installations’ refers to any oxidation of fuels, regardless of the way in which heat, electricity or mechanical energy produced by this process is used, and any other directly associated activities including waste gas scrubbing (EC, 2010). This corresponds to ETS activity code 20.
[2] Corresponding to EU ETS activity type codes 21-99.
References
EC, 2010, Guidance note on interpretation of Annex I of the EU ETS Directive (excl. aviation activities), accessed 8 December 2021.
EEA, 2021a, ‘EU Emissions Trading System (ETS) data viewer’, European Environment Agency, accessed 8 December 2021.
EEA, 2021b, ‘Share of Energy Consumption from Renewable Sources in Europe’, European Environment Agency, accessed 8 December 2021.
EEX, 2021, EUA primary market auction report, European Energy Exchange, accessed 8 December 2021.
ETC/CME, forthcoming, Trends and projections in the EU ETS in 2021, European Topic Centre on Climate Change Mitigation and Energy.
Eurostat, 2021, ‘Net electricity generation by type of fuel, monthly data [nrg_cb_pem]’, accessed 8 December 2021.
ICE, 2021, ‘Auctions – EUA UK, market data’, Intercontinental Exchange, accessed 8 December 2021.
Identifiers
Briefing no. 17/2021
Title: The EU Emissions Trading System in 2021: trends and projections
HTML - TH-AM-21-017-EN-Q - ISBN 978-92-9480-417-4 - ISSN 2467-3196 - doi: 10.2800/897551
PDF - TH-AM-21-017-EN-N - ISBN 978-92-9480-416-7 - ISSN 2467-3196 - doi: 10.2800/758381


Document Actions
Share with others