All official European Union website addresses are in the europa.eu domain.
See all EU institutions and bodies
An official website of the European Union | How do you know?
Environmental information systems
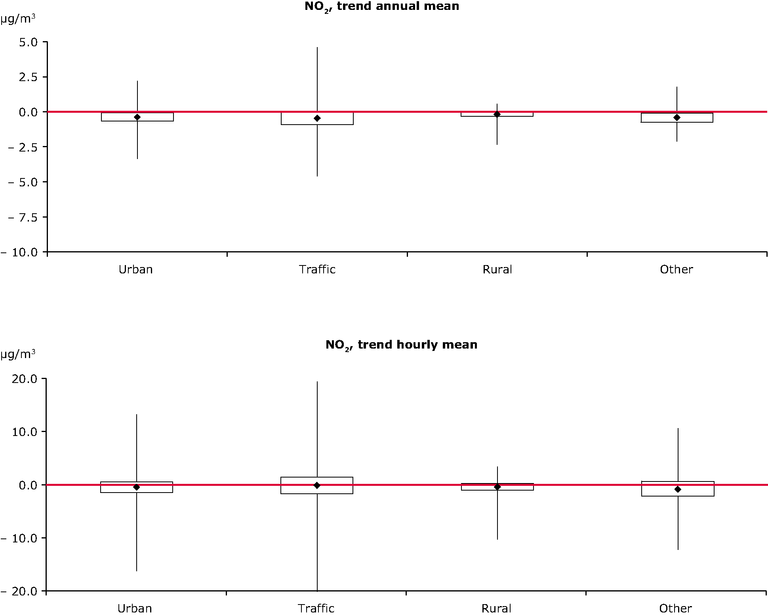
The graphs are based on annual mean concentration trends (top) and the trends in percentile 99.78 of NO2 hourly values
(bottom); they present the range of concentration changes per year (in μg/m3) per station type (urban, traffic, rural, and
other — mostly industrial). The trends are calculated based on the officially reported data by the EU Member States with a
minimum data coverage of 75 % of valid data per year for at least 8 years out of the 10-year period.
The diagram indicates the lowest and highest trends, the means and the lower and upper quartiles, per station type. The
lower quartile splits the lowest 25 % of the data and the upper quartile splits the highest 25 % of the data.
Loading