All official European Union website addresses are in the europa.eu domain.
See all EU institutions and bodiesAn official website of the European Union | How do you know?
Environmental information systems
EN
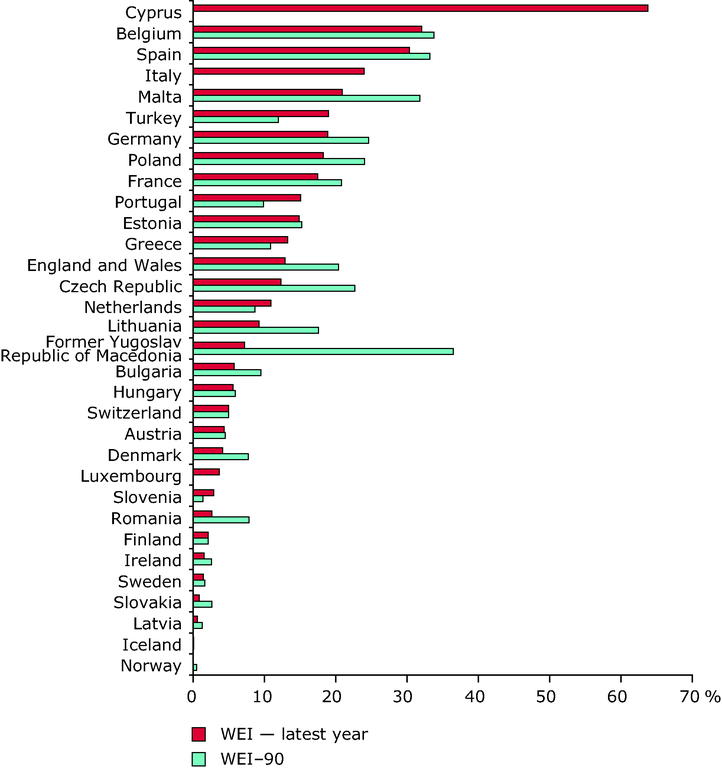
WEI: annual total water abstraction as a percentage of available long-term freshwater resources.
Loading