Personal tools

Sign up now!
Get notifications on new reports and products. Currently we have 58716 subscribers. Frequency: 3-4 emails / month.
Follow us
Twitter icon Twitter
Facebook icon Facebook
YouTube icon YouTube channel
RSS logo RSS Feeds
Notifications archive

Write to us Write to us

For the public:


For media and journalists:

Contact EEA staff
Contact the web team
FAQ

Call us Call us

Reception:

Phone: (+45) 33 36 71 00
Fax: (+45) 33 36 71 99


next
previous
items

Skip to content. | Skip to navigation

Sound and independent information
on the environment

You are here: Home / Data and maps / Maps and graphs / Water Exploitation Index (WEI)

Water Exploitation Index (WEI)

Created : Nov 12, 2009 Published : Jan 09, 2009 Last modified : Nov 29, 2012 11:39 AM
Topics: , ,
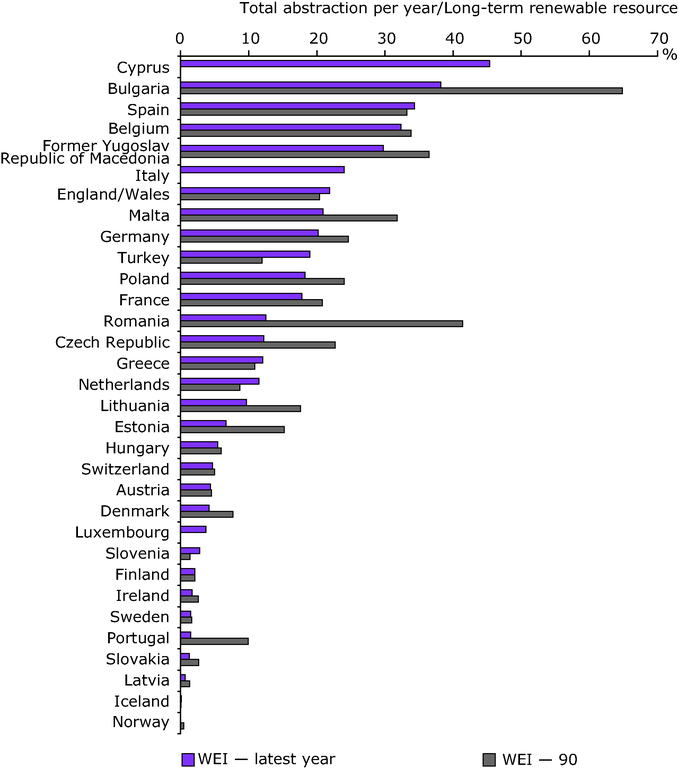
Better information will help us adapt The Water Exploitation Index (WEI) is a good example of the type of information needed to give an overview of the scale and location of the problems facing us
This is the latest published version. .

Download

Metadata

Additional information

In simple terms, the index shows available water resources in a country or region compared to the amount of water used. An index of over 20 % usually indicates water scarcity. As the graph shows, nine countries are considered;water stressed: Belgium, Bulgaria, Cyprus, Germany, Italy, the former Yugoslav Republic of Macedonia, Malta, Spain, and the United Kingdom (England and Wales). WEI data are available for England and show that the South East and London are especially stressed. This level of information is key in terms of effective adaptation to climate change. By understanding how much water is available in a region, where it is coming from and who uses it, we will be able to build effective local strategies to adapt to climate change.

European Environment Agency (EEA)
Kongens Nytorv 6
1050 Copenhagen K
Denmark
Phone: +45 3336 7100