Personal tools

Sign up now!
Get notifications on new reports and products. Currently we have 60221 subscribers. Frequency: 3-4 emails / month.
Follow us
Twitter icon Twitter
Facebook icon Facebook
YouTube icon YouTube channel
RSS logo RSS Feeds
Notifications archive

Write to us Write to us

For the public:


For media and journalists:

Contact EEA staff
Contact the web team
FAQ

Call us Call us

Reception:

Phone: (+45) 33 36 71 00
Fax: (+45) 33 36 71 99


next
previous
items

Skip to content. | Skip to navigation

Sound and independent information
on the environment

You are here: Home / Data and maps / Maps and graphs / Water abstraction for irrigation (million m3/year) in early 1990s and 1998-2007

Water abstraction for irrigation (million m3/year) in early 1990s and 1998-2007

Created : Aug 31, 2010 Published : Aug 31, 2010 Last modified : Nov 29, 2012 11:36 AM
Topics: ,
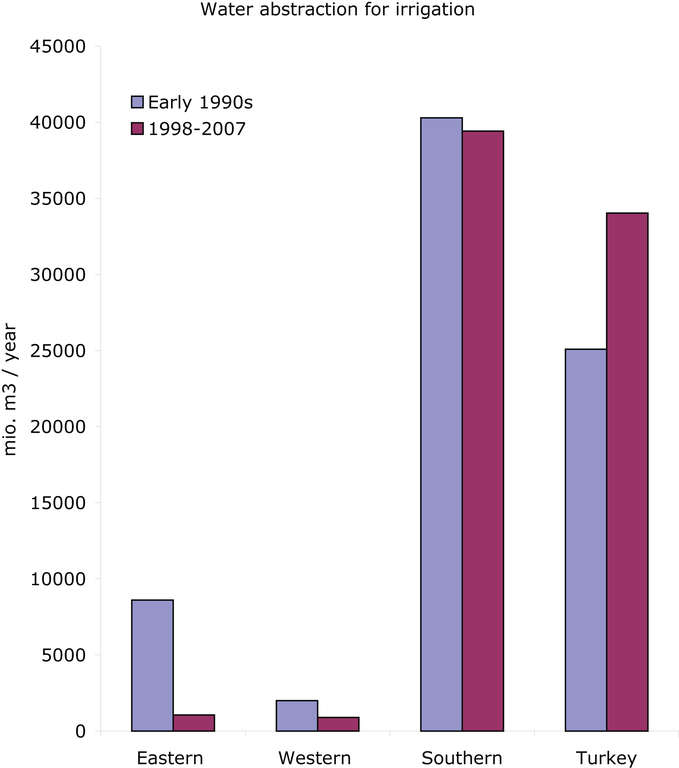
Eastern: Bulgaria (1990;2007), Czech Republic (1990;2007), Hungary (1992;2006), Latvia (1991;2007), Poland (1990;2007), Romania (1990;2006), Slovakia (1990;2007), Slovenia (1990;2007), Western: Austria (1990;2002), Belgium (1994;2007), Denmark (1990;2004), England & Wales (1990;2006), Finland (1994;2005), Germany (1995;2002), Netherlands (1995;2006), Norway (1995;2006), Sweden (1990;2007), Southern: France (1991;2006), Greece (1990;2007), Portugal (1990;1998), Spain (1991;2006), Turkey: (1995; 2007) Turkey is plotted on an individual column in this graph to depict the large increase in agricultural water use, and to avoid the projection of this trend/effect on the Southern countries trend.

Download

European data

Metadata

Additional information

Turkey is plotted on an individual column in this graph to depict the large increase in agricultural water use, and to avoid the projection of this trend/effect on the Southern countries trend.

Related content

Comments

European Environment Agency (EEA)
Kongens Nytorv 6
1050 Copenhagen K
Denmark
Phone: +45 3336 7100