All official European Union website addresses are in the europa.eu domain.
See all EU institutions and bodiesAn official website of the European Union | How do you know?
Environmental information systems
EN
- БългарскиBG
- češtinaCS
- HrvatskiHR
- danskDA
- NederlandsNL
- ελληνικάEL
- EnglishEN
- eestiET
- SuomiFI
- FrançaisFR
- DeutschDE
- magyarHU
- ÍslenskaIS
- italianoIT
- LatviešuLV
- lietuviųLT
- MaltiMT
- NorskNO
- polskiPL
- PortuguêsPT
- RomânăRO
- slovenčinaSK
- SlovenščinaSL
- EspañolES
- SvenskaSV
- TürkçeTR
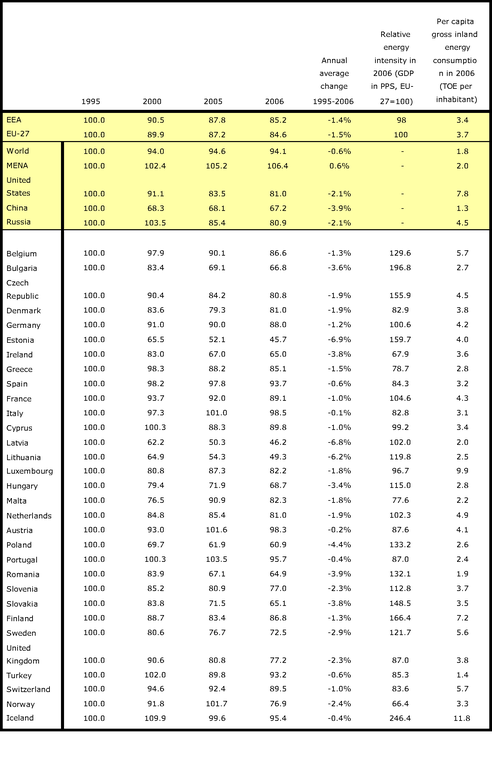
Total energy intensity 1995-2006 (index 1995=100), relative energy intensity (as PPS) and per capita consumption
Chart (static)
The year for the reference index value is 1995 because GDP was not available for all EU countries in 1990
Downloads
Data sources
Metadata
More info
Loading
- Austria
- Belgium
- Bulgaria
- Cyprus
- Czechia
- Denmark
- Estonia
- Finland
- France
- Germany
- Greece
- Hungary
- Iceland
- Ireland
- Italy
- Latvia
- Liechtenstein
- Lithuania
- Luxembourg
- Malta
- Netherlands
- Norway
- Poland
- Portugal
- Romania
- Slovakia
- Slovenia
- Spain
- Sweden
- Switzerland
- Turkey
- United Kingdom
1990-2006
The second to last column shows the energy intensity measured in purchasing power standards relative to the EU-27. These are currency conversion rates that both convert to a common currency and equalise the purchasing power of different currencies (by analysing the prices paid in each country for a basket of similar goods and services). They eliminate the differences in price levels between countries, allowing meaningful volume comparisons of GDP. They are an optimal unit for benchmarking country performance in a particular year. No data was available from IEA for Djibouti and the Palestinian territories. Also no data was available from the United Nations Statistics Division for the World, Qatar and the Palestinian Territories. For Qatar and the world data from the IMF is used. TOE refers to Ton of Oil equivalent. MENA refers to Middle East and North Africa